Philosophy

Film Medium as a Mental Balm

This post is as much about film photography as much is it about the human mind. We begin first with the mind.

Mind

Just like other organs of the body, mind exists in the body as yet another organ. It is special because it makes you aware of the other organs, their needs, and is even aware of its own existence (sometimes even wondering about it). The mind is the fountainhead of the entire human process – it invents philosophies, religion, languages, possesses the ability to imagine, wage wars, make love, preach peace, converse, and develop complex societal constructs like religion and marriage for collective sustenance and so on. It even invented the concept of “blogging” and consequentially, even produced this blog. But sometimes the mind needs care and nurture. Just like an engine of a 2009 Mini Cooper that eats quarts of oil, and sputters and halts during the most intense of trips in the Sierra ranges, the mind collapses from time to time. Too many browser tabs are open in the mind, all the RAM is eaten up. The browser freezes, life freezes. The body tirelessly cranks the engine, hoping that some fuel will reach the chambers of the gray matter and will ignite it to life – but the stubborn mind does not relent. This post is not about understanding the what led to the freeze, but about how we can begin thawing our thoughts via loving how to capture life.

Film

50% humans on the planet are now 3 seconds away from taking a picture. What used to be a involved and time consuming process that required knowledge of optics, chemistry, physics, “tricks” and an artistic passion for capturing life, is just second nature now. Getting bored and nothing else to do? Take out your phone, strike your favorite facial expression and boom! Selfie! The marvel of a ghostly image on a silver-plated copper sheet and then eventually a negative on a celluloid film is not awe-inspiring anymore. But a film has been a special invention. It was not instant gratification. It required some thought, some moment to reflect, some skill, anticipation and acknowledgement of a technological limit. I recently showed a few film negatives to some very young Instagrammers in a remote town in India and they found it hard to believe that it took days from the click to an actual photograph that you could see. And film is not that old. The situation of where film resides right now in the history of photography is somewhere at the intersection of hipsters, film school students, experimental artists, hobbyists and possibly some weird people like me who think film can heal your mind.

But indeed, it can.

Do not rush. Pause and ponder. Minolta XG-1. Rokkor 50mm ~ f/4. ILFORD HP5 Plus

Impermanence

The process of film capture and processing is not just click and chemicals. It is an appreciation of the marvel of the universe and understanding our insignificant role in it. Each film photograph is a cosmic event, a happenstance, a confluence of universe creating the right condition for allowing you to pause life in its tracks. For each film photograph you have seen, millions of photons reflected from the objects you see came directly or indirectly from the energy of the sun, which in-turn came from the womb of our Milky Way as part of a solar nebula. The silver-halide crystals on the film came from the same star-birth, trapped in the layers of earth until a human discovered that one can use light to darken it and other humans worked on perfecting the technology to freeze these them on their tracks in a celluloid film. These tiny silver grains, each with their own chemical story, a history of existence, now sitting comfortably, with varying degrees of darkness somehow making a picture. In life as well, situations exist in shades of gray. And whats more! It all happened with a “click”. Somehow a few electrons in a photographer’s mind fired, the hand moved and the gentle curtains inside the camera drew back as if welcoming these photons – the actors of life – on stage, with cheer and applause and let them in on the tiny theater inside the camera where the only person in attendance is you and the film. A film which impartially received it and stored it. The film does not judge. The film only captures. In this sense, a true photographer will not judge the photons, and thus will not judge who produced them, be it objects or humans or the circumstances in the theater of life that it captures. You will not judge what enters your mind as life plays out. Your role is limited. In cosmic scales, you are a mere “click”. All your worries, desires, lost and found loves, family, Taj Mahal, Himalayas, the suffering millions or the nefarious tech bros – all will perish just as the waves of time level the beach sand. Eventually, even the film fades away. The first lesson of film is the acceptance of duality – of impermanence in a seemingly permanent record.

Anticipation

Life, though seemingly complex, is lived simply in the present. Minolta XG-1. Rokkor 50mm ~ f/5.6. ILFORD HP5 Plus.

The image from a film camera’s lens is not captured on film. It is captured first in the mind of a photographer via the viewfinder. In precisely a few microseconds before the click, the mind captures and develops the film, it even views it, anticipates and marvels at the fine shades and exposures – the color tone, the perfect metering and the marvelous job they must have done in selecting the shutter speed. Mind wonders what might happen when the photograph is finally developed – will it give me laurels and global appreciation? Will my grand-kids ever wonder what their grandfather was doing with a hammer, breaking a random wall in Berlin? Will the masses reading the newspaper tomorrow stand up and take action when they see the bleeding skull of an innocent boy while bombs fell and leveled his home? Will my fiancee remember this first scooter we bought together as she gets old? Will she even remember me by then? Each thought rattles the mind a tiny bit. As life flashes before your eyes when you die, the life of a photograph flashes before the photographer’s eyes as the moment of the click approaches. But the click is inevitable. Whatever the anxieties and anticipations that were built up to the click – the ones that all happened in microseconds – they are immaterial now. The film is the record of truth. It now has the tiny piece of life safely tucked in the darkness of the camera. What transpired is immaterial. What will be developed is the inevitable truth. You see, your emotions towards the film were not permanent. As the photograph develops, your response to it will change, your life and your anticipations will readjust. Yes, at the time of the click you had just one “shot” to fame, or maybe the one special moment in your life you wanted to hold on to. But now its gone. Its purpose is fulfilled. It’s time to roll the film and take another shot at life. A photographer has to internalize that while time in life is not infinite as the shots are just 36 in a roll, not every one of them will always amount to something. But they all will lead to the roll being development ready. The real story of life will be in the complete roll. Each shot is just a passing moment.

Desires

A photographer desires the flashiest of optics, the longest of the rolls, the films with dynamic speed ranges. Some might even dream of a 110 film with grain quality of a medium format, but the realities of film science and life come in the way. You got a simple Minolta with smudges on the lens? The light is bad, the film stock is a lousy 5 year old Kodak ColorPlus 200 with just 3 usable shots left? But you are parked at the side of an unnamed road, sipping tea with your most intimate friend. Hearts have been poured out, and time is short as parting nears. You can’t desire time to be stopped or the best golden hour light to shine and capture this bittersweet moment within this moment. Sometimes, all you need is to take out the Minolta and just take the shot. Without getting weary of anticipation, do understand that things in life will not be infinite, all resources, especially time, is limited. Capture it with whatever you have. Know that limited does not mean less. To capture a whole human life, even 36 shots are all that is needed. It’s just that value of each shot will increase. Similarly, to drive around, a 10 year old Mini will just do fine. You don’t need the Mustang Mach-E. You just need to understand the ephemeral nature of things and keep the least and the most valuable to you, close. For last 10 years, I have more or less lived out of two suitcases. I believe, the memories I have had are more value to me than things. Moments of joy, are actually worth more to you especially when they are few and far between. A film will give you those memories. It will teach you to limit the desires, it will show you why a single shot is important. Each shot, good or bad will receive the same care of chemicals until it develops and until you pause, ponder over the negatives and smile as you hold them across the light – readjusting your anticipations with a feeling of contentment in less possessions. Our desires will not end and the modern world teaches us to desire more, crave more. But the way of a film photographer is to hold each film in the hand, thank the cosmic providence for bringing you this raw material to stop time momentarily. And then roll in the cartridge, pause and take each shot with humility and thought.

Developing Clarity

Film needs love. As we talked before, it is not an instant process. Just as a dry seed can live hundreds of year in extreme dearth, pain and arid climate, but it only germinates when it gets the right conditions to trigger the germination gene, a film is not ready when you click. It lives in the darkness, only absorbing the random, brief moments of life when the photographer allows it to. Beyond that, it just exists. Passively. But only once its time has come, the film is ready for development. It is developed not just with chemicals, but with extreme care and love. It is developed with skill, with the correct time, temperature, the correct developer, stopper and fixer chemicals. Each film stock is different – so different chemicals and variables for black and white, color, ISO. Developing times are carefully tuned for the kind of “clarity” you need in a photograph. When the negative is transferred to a photo paper, it feels like the veil lifting from a chaotic mind. A mind also develops clarity when it is washed with the chemical of life experiences. You learn who is here to stay till the end and who will leave when the ground shakes. You learn how society works – the joys, sorrows and inequalities it contains. The selfless service of some saints and the absolute villainy of scoundrels. Just as in a black and white photograph, the complete image is formed in shades of gray. There are no absolutes. There is no point in achieving the ideal perfect state – life exists only degrees of imperfection. Each person’s mind is like a film. It is different, it will develop clarity when the conditions are right, the washing time is correct and the temperature is just perfect. In addition, one cannot force clarity when the time is not right. Sometimes the mind is restless, and rightfully so. Just as the shock of light in the dark chamber of the film camera leaves the film in awe, the exposure, however brief, takes time to take hold and make sense of it all. As on film, the mind reflects what happened in that instant. And without judgement, the photographer winds the roll forward. Once all shots are taken – only then is the film ready for development. It’s ready for the wash, the holy dip in the Ganges, the sweat of the bike ride on Mt Hamilton or the tears of recovery. They all are part of the chemical wash to get a clear image. Once again, a new roll is picked, once again film is ready, this time, traveling through eastern Sierra mountains and the deserts of Nevada – taking in new images, new experiences. This time, the photographer and the film are ready. They know the concept of impermanence, of anticipations and of desires. The light is now more sharp, the development time will be adjusted post exposure to get a different and new clarity in life.

But when the world is ending, you’d come over, right?Minolta XG-1. Rokkor 50mm ~ f/5.6. ILFORD HP5 Plus.

Why Film?

Why does it matter? In view of the impermanence of it all – why capture on film? What is the point? I can capture 100 photographs in a few seconds on the iPhone.

But did you really?

I think smartphone is capturing moving life. A camera however inspires you to captures a story. Film photography is not a nostalgic hobby. In the 21st century, it is a cleansing ritual. Of course, in a material sense it may be an expression of art or an occupation in legacy film education or just someone gaining hipster creds. But for me it has been a process to pause and think. A ritual of getting chemicals, beakers, a Minolta, re-visiting childhood memories of our bathroom darkroom, of learning optics and photo chemistry. A ritual of reflection on thoughts that cross my mind as I click the photos. A joy of washing and developing something with love and effort and something tangible that my fingers appreciate. It allowed me to not just look at a photo and think about the moments with joy or sadness, but add a layer of distraction around the quality of the print, the execution of the development process, the research on optimizing fixer use, the careful observation of the minute silver crystals embedded in the film and constant worry if I might have overexposed that one shot I really cared about. It made me escape everything. I knew I needed a wash. And redoing film after 20 years gave me this chance. So, capture the photons that seem to matter at the moment. Capture them and process film to attain some clarity – clarity of acknowledging impermanence, of understanding futility of ever increasing human desires and managing anticipations. While life continues to exist irrespective of capturing a slice of time on a film, consider the process of capturing life as a part of life itself. It is the part that makes you a photographer. A part that allows you to pause and observe. It allows you to love, but love something unconstrained, unconditionally.

Where does this path lead?

Nowhere and everywhere. While everyone has their own path, for me, this path leads me to wonder about the dichotomy of romantic and the rational viewpoints regarding film and life. (suggested reading: Zen and the Art of Motorcycle Maintenance by Robert M Prisig). While film aesthetics are important to me and I’ve been obsessed with grains, scanning and photo processing now, I have also bathed in the romantic aspects of photography. I crave for understanding the camera machine as much as the emotions an event of taking a photo and the photo itself can produce. Mundane moments are special to me now. I write poems for each photograph that makes me think about it more (not kidding!). Kinda like a creative distraction itself. As I dived deep in film, I acquired a Fujifilm XT-30. I have been assessing film aesthetics in the film simulation mode and tuning the simulations. In my head, my XT-30 is a film camera. Mostly, I click pictures in ACROS film simulation by default and imagine that I just have 36 shots for one session. Each photo now counts. Each photo is personal and each one records a story in my mind as I click it. A tiny narrator in my head narrates my thoughts to me. I wait a while after I click, and only then view the images in peace – with Lucky Ali songs in the backdrop 🙂 Silly, for sure. But as I said, for me this is a ritual for learning how to live.

Standard
Philosophy

A Case for Study of Psychedelics and Consciousness

Kala Kshetram — Lotus on temple ceiling , Thillai Natarajar Koil,...
Lotus on temple ceiling , Thillai Natarajar Koil, Chidambaram, Tamil Nadu (Source: Arjuna Vallabha)

Navigating everyday mundane life is just what it is – life. A few of us do indulge in time for reflection and meditation. Some of us pursue complex rituals to achieve meditative state and some do it in much more aggressive manner such a working in a “flow” state. The goals are different, but from time to time we do achieve “different” states of consciousness momentarily – but never densely getting involved in deciphering them, understanding them. Even eastern societies, which have spent considerable amount of time and efforts in past to understand consciousness and trying to organize it are now somewhat leading life in a set of the same “normal state”. I get reminded of someone I know who was visibly angry about discussions on sexuality, but would pray to a Shiva lingam daily – without knowing the philosophy that it encompasses. Much of our lives we may navigate with such opacity in our actions. Still, from time to time, we do peek into our consciousness itself. Maybe praying to a Shiva or Allah didn’t help today, but your mom smiled at you and ran her hands through your hair and your heart melted with a rush of hormones in your body. You experienced something. And along these lines, I’ll discuss some possibilities of understanding states of consciousness.

Life, Universe and Everything

While searching some thing unrelated, I recently stumbled upon the following video, parts of which I will discuss in this blog.

Having never ingested any mind altering chemical yet, this video fascinates me. First, its not some random dudes or Vice News collecting YouTube likes and cash by playing with LSD and creating “you won’t believe..” click-baits. Secondly, and most importantly, it is a very interesting summary and attempt to mathematically classify/categorize mental and physical experiences upon ingesting a chemical. The tone remains scientific and inquisitive and there is an attempt to classify visual patterns in altered states under DMT influence – with a special focus on hyperbolic geometry. The people behind this look like serious folks attempting to uncover at least some mysteries of consciousness and meaning of life. And its refreshingly new work in the field of study of consciousness. Andrés has attempted to quantify bliss algorithmically using fMRI imaging and theory of harmonics. I am new to the realm, but these folks are like modern age Yogis with tools of science in one hand and skepticism in another. New age philosophies may evolve and limits of our understanding itself may get tested in these circles.

This specific talk was delivered at a new club at Harvard called Harvard Science of Psychedelics Club and what follows are some of my views on it.

Math and Nature

So, my first solid introduction to fractals was in the Parallel Computing Systems course I took during my PhD. Our instructor had asked us to parallelize creation of a dragon curve – probably a Heighway Dragon or Twindragon using OpenCL and observe the speedup. I took the opportunity to investigate other fractals and what awestruck at Mandelbrot Set and its co-relation with Logistic Map. In one equation I could see the similarity between seemingly magical population stabilization as well as striking similarity with Cyclamen leaves that have similar (but not same) patterns – just one equation folds and unfurls new and unrelated phenomenon in nature.

Mandelbrot Set Pattern on Cyclamen Leaves - EPOD - a service of USRA
Source: Thalia Traianou

Andre’s talk opened my mind further and first introduced me to the tangible difference between euclidean geometry and hyperbolic geometry. I could associate with it better now. Next, what just amazed me was how the variation in DMT doses brings about varying changes in experiences. Multiple variables are responsible for what happens. Keeping aside the awesomeness of actually experiencing world in complex geometrical patterns, the actual geometry you “reach” changes with how much mg of DMT you take. So hyperbolic geometry may manifest in higher doses as your “trip” progresses and you may see beings and other objects. This is the visual part. At the same time, you also “feel” – this again is interesting. Bliss states have been observed along with confusion on seeing entities. The mind tried to makes sense of what it sees, the chemicals keep it grounded. Things seem unreal but not totally unfamiliar. Of course, these are what I hear from some brave psychonauts (as they call them) who took DMT and write about their trip experiences. For a more comprehensive read, you can go through this work by Andres. It is just so interesting to see the patterns that we experience are very very close to nature manifesting such things and allowing us to perceive them even in our “normal state”.

Thoughts on DMT Research

Limits of Visual Comprehension? What is also very interesting to observe is in the the actual overlapping between what your visual sensors are telling you and the very same patterns that exist in nature. Such geometries exist around us, (in broccoli, corals, crystal lattices) and can be mathematically deduced. At the same time, our brain starts to see all things in these “wallpaper modes”. Metaphorically, it is as if your eye leaves the body, becomes small and sharp as a laser beam and traverses the microscopic structures in materials that surround us while at the same time also remaining in your head and looking at the world as is in its normal dimensions. Then superimposing both these projections. I think there are some possibilities on why we experience what we experience while on DMT:

  • Our brain could potentially have the capability to synthesize DMT endogenously in lower doses (research is ongoing). Since most of our matter has very familiar, mathematically defined structures, so does our brain and its perception mechanism and what defines (the yet unknown) consciousness. Hence, we could be accustomed to DMT since ages – we just don’t know it yet. We evolved with the molecule evolving with us (serotonin and melatonin are structural analogous chemicals human body produces) There may be ways to unlock our heightened perception via meditation (again, maaaybe), or very scientifically via direct vapors/oral ingestion of similar compounds. So, in the past we actually may have had mechanisms in our primitive minds to understand the tripping wallpaper modes and things we call DMT objects and structures while in a trip – but we don’t really have access to it anymore since our consciousness is now limited – our “normal state” is now just too normal maybe. So, DMT acts very chemically here – no magic – just pure reactions happening in a meatbag.
  • Another possibility is that we actually unlock parts of our brain momentarily via chemicals and we do really unlock very radical and unaccessed consciousness states, but since we can’t understand what we are perceiving, our brain tries its best and projects very fundamental mathematical structures that the brain can comprehend while giving a meaning to it somehow – keeping depth perception there momentarily for example and projecting patterns over 3D objects. In addition, while discussing the yet non-qualitative part here – chemical interactions are also responsible for similar ones that serotonin etc would produce – bliss, love. So, a complex interaction of our brain making sense of heightened conscious states and some of the base “feelings” is what we are left with. We may discover deep inner workings of the mind, nature and everything. Maybe opportunity to answer the eternal questions about our existence that various religious figures have tried over millennia, but failed.

Similarity with religious elements. All such experiences have been very similar and consistent to religious/yogic experiences we have heard/read about. Infact, such is the influence that we have codified much of this in the form of practices that elevate our conscience. Yogic practitioners consistently (but till now, unscientifically) have reported very similar experiences to DMT – experiencing entities, oneness with each and every element of nature, pure bliss, unlocking of Sahasrara Chakra via Kundalini and visualizing chrysanthemum state patterns (adapted to Lotus forms in India) . Such has been the significance in Indian traditions that most ancient and even modern temples have incorporated such patterns and symmetries in their architecture – as if constantly reminding us of the brief glimpses one might see of the “other side”. There is high probability that much of religion is result of folks that were high on chemicals or genuinely had unlocked heightened consciousness via meditation etc. And then, returning from the trips, explained positive experiences to benefit the rest of humankind living in its “normal state”. Almost all enlightened folks/prophets have been described throughout history as being compassionate, calm, devoid of ego or any extremes of emotions. I believe DMT in a proper context of self-awareness may be delivering such a mental alteration as well – and of course many new folks have reported this (till now unscientifically as well) in the New Age thought driven spirituality.

Material and energy interactions. Condensed down to a very fundamental form, it seems quite true that all our conscious states are a result of material and energy interactions – a constant intermixing and transformation of this happening in our body. Very similar things happen on cosmic scales as well to large amounts of matter and energy. In that sense the approach to this may seem very nihilistic. Everything is actually nothing. All our emotions, ego, achievement, everything we’ve loved, hated, created and the whole existence is insignificant in terms of how they happen and on larger scales. Thus, our complete consciousness and and any attempt to alter conscience is also meaningless since it arises from such matter-energy interactions. But herein lies the catch – we still have to find if there is meaning or not in order to judge whether this nihilistic hypothesis is true or not. And for that, DMT altered states at least provide a more grounded tool to explore this next unknown realm.

We see very different phenomena very similarly visually – shapes on leafs, lightning, corals as well as galaxies – showing there is some math, but then there is also enough chaos and still undiscovered/unexplained phenomenon that is observed while on psychedelics. So, there is much left to understand why we see what we see. As a scientist, this is enough for me. There is an unknown observed phenomenon, and we must understand what it is. Even if we are insignificant, consider this as an exercise small enough to indulge our senses. I hope to see some good coming out of this research that pushes boundary of our understanding of not just structural and functional components of our brain, but also our conscience. I also hope to access untouched areas of my brain someday to understand it and our existence better. If society is willing to accepted “trippy” temple ceilings and some total unscientific religious BS as truth, it should also normalize research on psychedelics for truly and holistically understanding science of the brain.

Standard
Linux

Building an Esoteric Filesystem Tracing Tool with eBPF

I recently gave a talk at Storage Developers Conference 2020 in the Filesystems Track with my colleague Hani Nemati. For this talk, I chose to use the only technique I know (tracing) and hammer the Linux FS subsystem as much as possible to understand some specific areas of it that I’ve left unexplored. Here is one question that I asked Hani – how does read-ahead mechanism work in the kernel? For those not familiar with what read-ahead is, let me try to explain it.

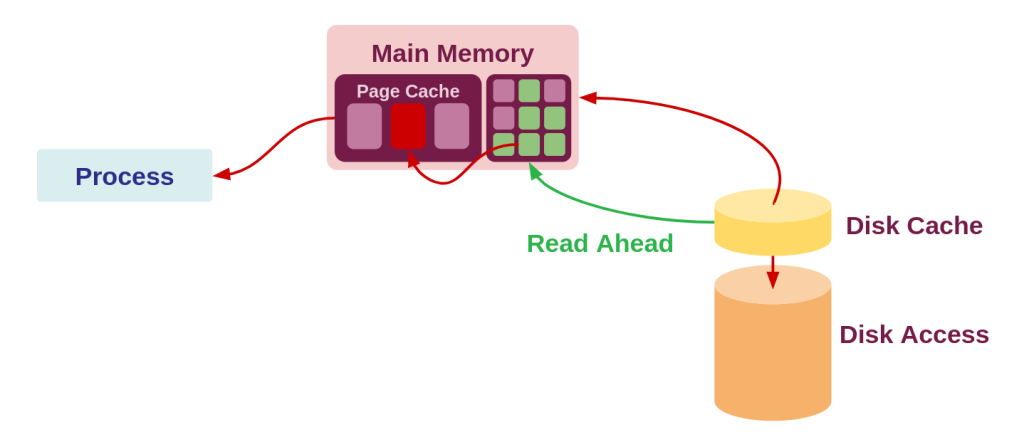
Reading the pages “ahead” for a streaming IO bound workload can help in improving performance

Consider an app that performs streaming/buffered read operations. A way to improve its performance is to ensure that, (1) we use a cache, (2) we fill that cache with prefetched data that we know the process would be requesting in the following moments and (3) we free the cached data upon touching it so more of the streaming data can fill it. This would probably avoids lots of cache misses and hence improves the performance. As you can see, this is a special case of performance gains. And of course, the decision of when the read-ahead mechanism in kernel should kick in is depending a lot on heuristics. Naturally, such over-optimizations for very specific cases of application IO profiles can actually damage read performance for the normal cases. This was also noted in a discussion 10 years back on LWN. For example, for some older USB memory drives, since the read performance can be slow, and the buffers will remain filled most of the time, and hence having a large read-ahead buffer could actually hamper the performance since the data may be paged out frequently thereby increasing the overall IO latency. Modern read-ahead is quite awesome though. To know more about how read-ahead triggering decisions are made, read the kernel code. The algorithm is called as “On-demand readahead” and is quite interesting. The Linux kernel does allow the userspace application to “advise” it instead of completely autonomously taking over all the time. And so, says the userspace to the kernel:

Hey mate, we are about to do a sequential read, tune your gears for this task, eh?

This is usually done using the MADV_SEQUENTIAL flag set in the madvise() or fadvise() syscall. There is another older syscall available as well, aptly named readahead() which basically performs the same technique directly. The Linux Test Project even maintains a micro-benchmark for testing its performance. Could be super interesting to actually use this to test on multiple disk types!

Coming back to the task at hand now. The goal of this post is to develop a tool to precisely measure if the read-ahead mechanism you may be loving so much is actually working for your specific workload or not? What if your NodeJS app uses a file operations module that has a transitive 5 layer deep dependency which leads to a native buffered read which is perhaps not using read-ahead the way it should be? The simple way is to make a tool that precisely does that this for a given process:

  • Track how many pages are in the read-ahead cache
  • How long have those pages stayed in the cache
  • At any given time, how many have been left untouched

So, if you are of the impatient kind, a CLI tool exactly for this very specific task does exist! It was written by Brendan Gregg in bpftrace lingo and is called as readahead. You could also read about it in his BPF Performance Tools Book. Infact, Hani and I started making it from scratch but found out it was already there so this has been of immense help in understanding what is going on under the hood! However, we decided to port it to BCC and also give it some visualizations with Grafana. Another recent variant of the tool also exists and uses the new libbpf directly (which is now the recommended way to write BPF tracing tools according to Brendan:

And so, this is what the post is about – understanding how such a tool can be built with eBPF and how we can extend it to create nice auto-updating visualizations! We will look at both ways – the old (BCC Python/C) and the new (libbpf/CO-RE C) and learn how such tools can be built.

Tracking Read-ahead in Kernel

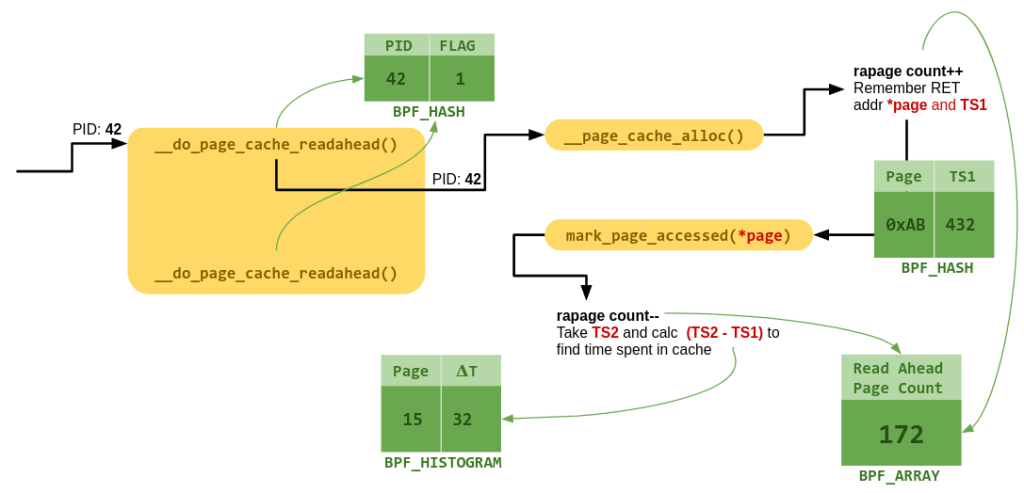
So the first task is to understand when read-ahead actually happens. To understand this, we go to filemap_fault() function. This is called from within a pagefault when there is a memory mapped region being used. Assuming page does not exist in the cache, it calls do_sync_mmap_readahead() from where we eventually call page_cache_sync_readahead() which is actually here. This is called when the vma has VM_SEQ_READ flag set. This is infact, based on our advice from userspace process before! Seems like we are getting close. This function then calls the actual read-ahead decision algorithm ondemand_readahead() which we talked about before. The algorithm makes some decisions and when it’s time to submit a readahead request it calls the __do_page_cache_readahead() function which actually reads the chunk of data from disk to the cache. It does so via allocating multiple pages with __page_cache_alloc() and then filling them up. So it seems we have reached the point where we have some idea what to track to fulfill our needs for this tool. One thing that is still remaining is to track if one of those pages that we just allocated have been accessed or not to see if the readahead cache is utilized properly. This is quite simple – each page that is accessed is marked by mark_page_accessed(). We now have all the pieces to track read-ahead cache and we can visualize it as follows:

For a given PID, track when we have entered __do_page_cache_readahead(). If we have entered it, and the kernel allocated a page using __page_cache_alloc(), remember the page address, increment the read-ahead page count (rapage here) and the note the timestamp when we allocated it (TS1). Now, each time that exact page is accessed, decrement rapage, take timestamp (TS2) and find out how long that page was in the cache (TS2-TS1). This way at any given snapshot of time, we will know:

  • How many pages are in read-ahead cache (rapage count)
  • How long they were there (map of TS2-TS1 and each page)

Writing the eBPF program

In case you didn’t notice this, the logic is looking much like a state machine. So, wouldn’t it be nice if we had some way to record state in some data structures? eBPF provides map based data structures to work with such logic. We will use the same in our program as well.

Readahead the old way (BCC Python/C)

Lets first look at the old way of using Python/C. You can still find the BCC tools in the BCC repos and here is the readahead program that I had ported to this format. BCC allows us to write our BPF tool in a hybrid C/Python format. The BPF part of the program is in C which gets compiled down to the BPF bytecode. This is then hooked to the necessary kernel function using bpf() syscall made via the Python part of the tool. We also used this Python code to make our lives easy since it provides some wrappers to read and update data shared from the from it – which will store our data such as timestamps and page counts. BCC provides us with some high level data structures like BPF_HASH, BPF_ARRAY and BPF_HISTOGRAM which are all built over generic KV store data structures called BPF Maps that we talked about before. They are used to maintain state/context and share data with userspace as well. The concept of maps and their creative uses is vast. I’ll link a small tool by Cilium folks called bpf-map that has helped me from time to time to understand what is in the maps and how they work. In our case, we use them as shown in the diagram below:

In the BPF C code embedded in the python program, you can also see the 4 functions (entry_* and exit_*) that we want to execute at certain hooks in the kernel. We used kprobes and kretprobes mechanism to attach these to the kernel functions. This is done via the python helper function here:

b.attach_kprobe(event="__do_page_cache_readahead", fn_name="entry__do_page_cache_readahead")
b.attach_kretprobe(event="__do_page_cache_readahead", fn_name="exit__do_page_cache_readahead")
b.attach_kretprobe(event="__page_cache_alloc", fn_name="exit__page_cache_alloc")
b.attach_kprobe(event="mark_page_accessed", fn_name="entry_mark_page_accessed")

As the readhaead python script is run and the BPF programs attached to the kernel methods, everytime the method is accessed the tiny BPF function executes and updates the BPF maps with the values from kernel! So all that remains is to periodically query the maps and start plotting some histograms. That is done easily since the data from maps is accessed via directly accessing the maps as keys from the “bpf object”:

b["dist"].print_log2_hist("age (ms)")

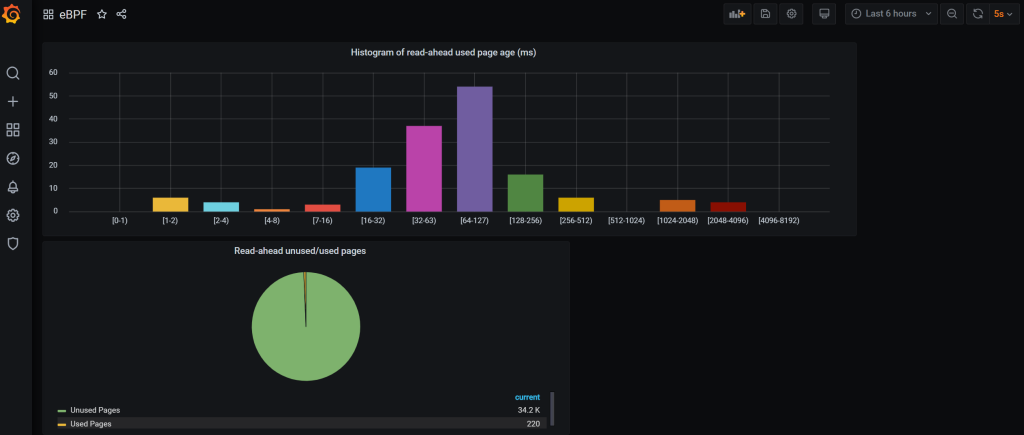
We could also extend it easily to push data to InfluxDB and then plot it in Grafana with just a few more lines as we can see here. This gives us some cool live graphs!

Grafana can be used to create to a live interactive dashboard of your custom eBPF tools with alerts, Slack notification dispatch and other such hipster features.

Seems cool, so why deprecate?

While this looks fine and dandy for one-off tooling, in order to build a more scalable and portable observation/debugging solution we need multitudes of such tools running in machines that have different kernel versions and resources at their disposal. Two problems arise:

  • Resources: BCC tools required LLVM toolchain, and Python to be on the machines where the tools are run since BPF bytecode had to be compiled on-the-fly from within the Python program and that too for the specific kernel version. This could easily be ~145 MB+ install while the compiled BPF programs that actually need to be inserted are essentially just a few kilobytes. The hosts system supports bpf syscalls so just managing and pushing BPF code to kernel should not require compiler tool-chains and python programming. Or should they? This brings us closer to the 2nd constraint.
  • Portability: What if we could pre-compile the BPF programs? This way we avoid the resource constraint! This is easier said than done. Infact, we tried to do this 3 years back when we built a tracing framework called TraceLeft where we went all crazy and tried to template the C part of the BPF programs, create a battery of pre-compiled programs and used gobpf library to push it to kernel! (yep, such horrors!) The issue is that some BPF programs gather very specific information from the points in which they hook in the kernel (tracepoints/k(ret)probes). Kernel data structures from which we need to gather data may change based on what kernel is being used on the system in which the BPF code is being run. On a massive distributed cluster with thousands of node each working on different versions and resources, how can we get consistent values from our eBPF sensors?

This is solved by two new key technologies in the BPF that have been recently introduced – BTF and CO-RE. I think both of them demand a separate deep dive, but in summary they allow type information to be stored in compiled BPF binary and kernel binary (much like DWARF symbols which help us in debugging and understanding programs at runtime) and then using this with Clang to write relocation values in the compiled program. At runtime, based on what kernel it is being run on, the libbpf based BPF program loader matches the kernel’s ABI info from running kernel’s BTF to the BPF program’s BTF data and does a rewrite of certain parts of the programs to make it run on the host kernel. Even though it is quite different, we can somewhat draw parallels with the technique of how relocation works in ELF binaries where at runtime the relocation symbols are replaced with actual library addresses. Won’t hurt to do some side reading on ELF Relocations if you want.

Readahead the new way (libbpf/CO-RE)

So, now lets try to do it the new way. Luckily for us, Wenbo Zhang ported it to libbpf/CO-RE C. It’s in two parts – the BPF code that will be compiled to BPF bytecode and the BPF program loader that uses libbpf and helps in tailoring the program to make it portable and loading it in kernel. Looking at the BPF code, the first familiar thing we see is the two BPF maps used for tracking when we are in the read-ahead mechanism and then a map of each page along with the timestamp. Here is the first map where the key is the PID and value is just a binary flag used to track if we are in readahead.

struct {
__uint(type, BPF_MAP_TYPE_HASH);
__uint(max_entries, MAX_ENTRIES);
__type(key, u32);
__type(value, u64);
__uint(map_flags, BPF_F_NO_PREALLOC);
} in_readahead SEC(".maps");

As we can see, we have a SEC macro which defines that this will go in the .map section of the compiled BPF ELF binary. This is followed by the actual BPF functions that go in their own sections. They are very similar in their behaviour to the previous BPF code we have seen and are supposed to be attached to the same 4 functions in the kernel that we need to build the readahead tool. Libbpf can then parse the BPF object and load individual parts from the binary to proper places in the kernel. This is quite standard and has not changed much since the olden days. Some old (and probably defunct) examples are here: https://github.com/Netronome/bpf-samples/tree/master/xdpdump You can see similar structure of a *_user.c program that uses libbpf to parse and load the BPF binary and its counterpart _kern.c program that is actually the BPF code that will be compiled and loaded. But what about those custom kernel headers that are being included? This is exactly where the new libbpf/CO-RE comes into the picture!

In the new approach, there is a single vmlinux.h which is all that’s needed. It needs to be generated from a kernel compiled with CONFIG_DEBUG_INFO_BTF=y. The next interesting part is the BPF skeleton header – readahead.skel.h. You can see that the readahead.c program has included this. This is actually generated using the compiled BPF ELF (readahead.bpf.c) containing the BTF information. Once generated, it provides the following functions that we will use to adjust the BPF binary and load it in the kernel:

  • readahead_bpf__open_and_load(): First the readahead BPF ELF binary is parsed and all its sections identified. Then all its components are created (the 2 maps we need, functions etc.). The 4 bpf functions and all other parts are now available in the kernel memory but no function has yet been executed.
  • readahead_bpf__attach(): Here, the each in-memory function from the loaded readahead BPF program is attached the the respective kprobes automatically. The program is now essentially live and will start collecting data in the maps as soon as we hit a __do_page_cache_readhaead() method now. Periodically, we can now access the maps from userspace and
  • readahead_bpf__destroy(): Once the program is finished. we can detach it and free the BPF objects kernel memory.

So it seems, we are almost at the end. The best way to build tools in the new libbpf/CO-RE style is to actually check how current tools are being ported. Check out libbpf-tools directory for more examples.

Suggested Reading

Tools of the Future

Imagine creating an army of portable BPF programs that you can ship across a fleet of heterogeneous hosts with no restrictions on kernels or features. And then use them to create your custom performance/security solutions – across userpace, kernelspace and the language runtimes in-between. Tools that require no explicit static instrumentation or crazy integrations, kernel modules – tools are versatile enough that they can be run always on, or used for post-mortem analysis. Tools that create flame-charts from API spans between services (on pods like abstractions) all the way down to the exact irregular network IRQ routine delaying your reads in the kernel on exactly of your 1000s of clusters. Couple that with visualizations that allow you to zoom in and out, temporally and qualitatively, without switching tools or context. I think with eBPF, we can finally have a unified language for observability and the ability to “craft what you want to see” and throw useless decade old vendor dashboards away.

Happy tracing!

Standard
Linux

Zero Day Snafus – Hunting Memory Allocation Bugs

Preface

Languages like C/C++ come with the whole “allocation party” of malloc, calloc, zalloc, realloc and their specialized versions kmalloc etc.  For example, malloc has a signature void *malloc(size_t size) which means one can request an arbitrary number of bytes from the heap and the function returns a pointer to start working on. The memory should then later be freed with a free(). These functions remain a quite decent points of interest for hackers to exploit applications even in 2019 – case in point, the recent double-free bug in WhatsApp which I shall discuss in a follow-up post.

So, I recently had a chat with Alexei who pointed me to his blog where he presents a pretty cool Ghidra based script to discover common malloc bugs. I got inspired from that and cooked up a few simple queries with a tool called Ocular that can help in discovering such issues a bit faster. Ocular and its Open Source cousin Joern were developed in our team ShiftLeft, which has one of its feet deep in the no-so-shady Berlin hacker scene (the other feet is ground firmly in the super-shady Silicon Valley circles). This will also be an opportunity to learn how Ocular and Joern work and understand their inner workings. If you don’t like security, you can at least learn Scala with these tools – like I did as well 😉

malloc() Havoc

So, coming back to the malloc() drama, here are a few cases where seemingly valid use of malloc can go really wrong:

  • Buffer Overflow: It may be possible that the size parameter of malloc is computed by some other  external function. For example, as Alexei mentioned in his post, here is a scenario where the size is returned from another function:
int getNumber() {
  int number = atoi("8");
  number = number + 10;
  return number;
}

void *scenario3() {
  int a = getNumber();
  void *p = malloc(a); 
  return p;
}

In this case, while the source of malloc‘s size argument is simply atoi(), that may not always be the case. What if the value of integer (number + 10) overflowed and became much more smaller than what was subsequently required (by memcpy for example)? It may lead to a buffer overflow when the accessing or writing to it.

void *scenario2(int y) {
  int z = 10;
  void *p = malloc(y * z);
  return p;
}

What if supposedly externally controlled y evaluates to zero? In this case, malloc may return NULL pointer, but its upto the user to make sure that there are NULL checks before using the allocated memory.

  • Intra-Chunk Heap Overflow: One of my favorite heap exploit that I have seen multiple times in the wild and have been victim of myself, is a case where in a given chunk of allocated memory, you accidentally overwrite one section while operating on another unrelated one. An example taken from Chris Evans’ Blog explains it quite well:
struct goaty { char name[8]; int should_run_calc; };

int main(int argc, const char* argv[]) {
   struct goaty* g = malloc(sizeof(struct goaty));
   g->should_run_calc = 0;
   strcpy(g->name, "projectzero");
   if (g->should_run_calc) execl("/bin/gnome-calculator", 0);
}
  • UAF, Memory Leaks: These are quite common as well – forgetting to free() allocated memory within loop constructs could lead to leaks which can in certain cases be uses to laterally cause malicious crashes or generic performance degradation. Another case is remembering to free memory, but trying to use it later on, causing use-after free bugs While not having a high reproducibility in exploits, this can still be caused when free is close to malloc and we try to reallocate (which generally returns same or nearby address) thus allowing us to access previously freed memory.

In this blog, we will attempt to cover the first two cases where we use Ocular to sanitize the malloc's size argument and see if they could eventually lead to buffer overflows or zero allocation bugs.

Ocular

Ocular allows us to first represent code (C/C++/Java/Scala/C# etc.) into a graph called as Code Property Graph – CPG (its like a mix of AST, control flow and data flow graphs). I call it half-a-compiler. We take in source code (C/C++/C#) or bytecode (Java) and compile it down to an IR. This IR is basically the graph we have (CPG). Instead of compiling it down further, we load it up in memory and allow questions to be asked to this IR to asses data leaking between functions, data-flow analysis, ensuring variables in critical sections are used properly, detecting buffer overflows, UAFs etc.

CPG-layers-flows

And since its a graph, well, the queries are pretty interesting and are 100% Scala and just like GDB or Radare, can be written on a special Ocular Shell. For example, you could say,

“Hey Ocular, list all functions in the source code that have “alloc” in their name and give me the name of its parameter”

This would get translated on Ocular Shell as:

ocular> cpg.method.name(".*alloc.*").parameter.name.l
res1: List[String] = List("a")

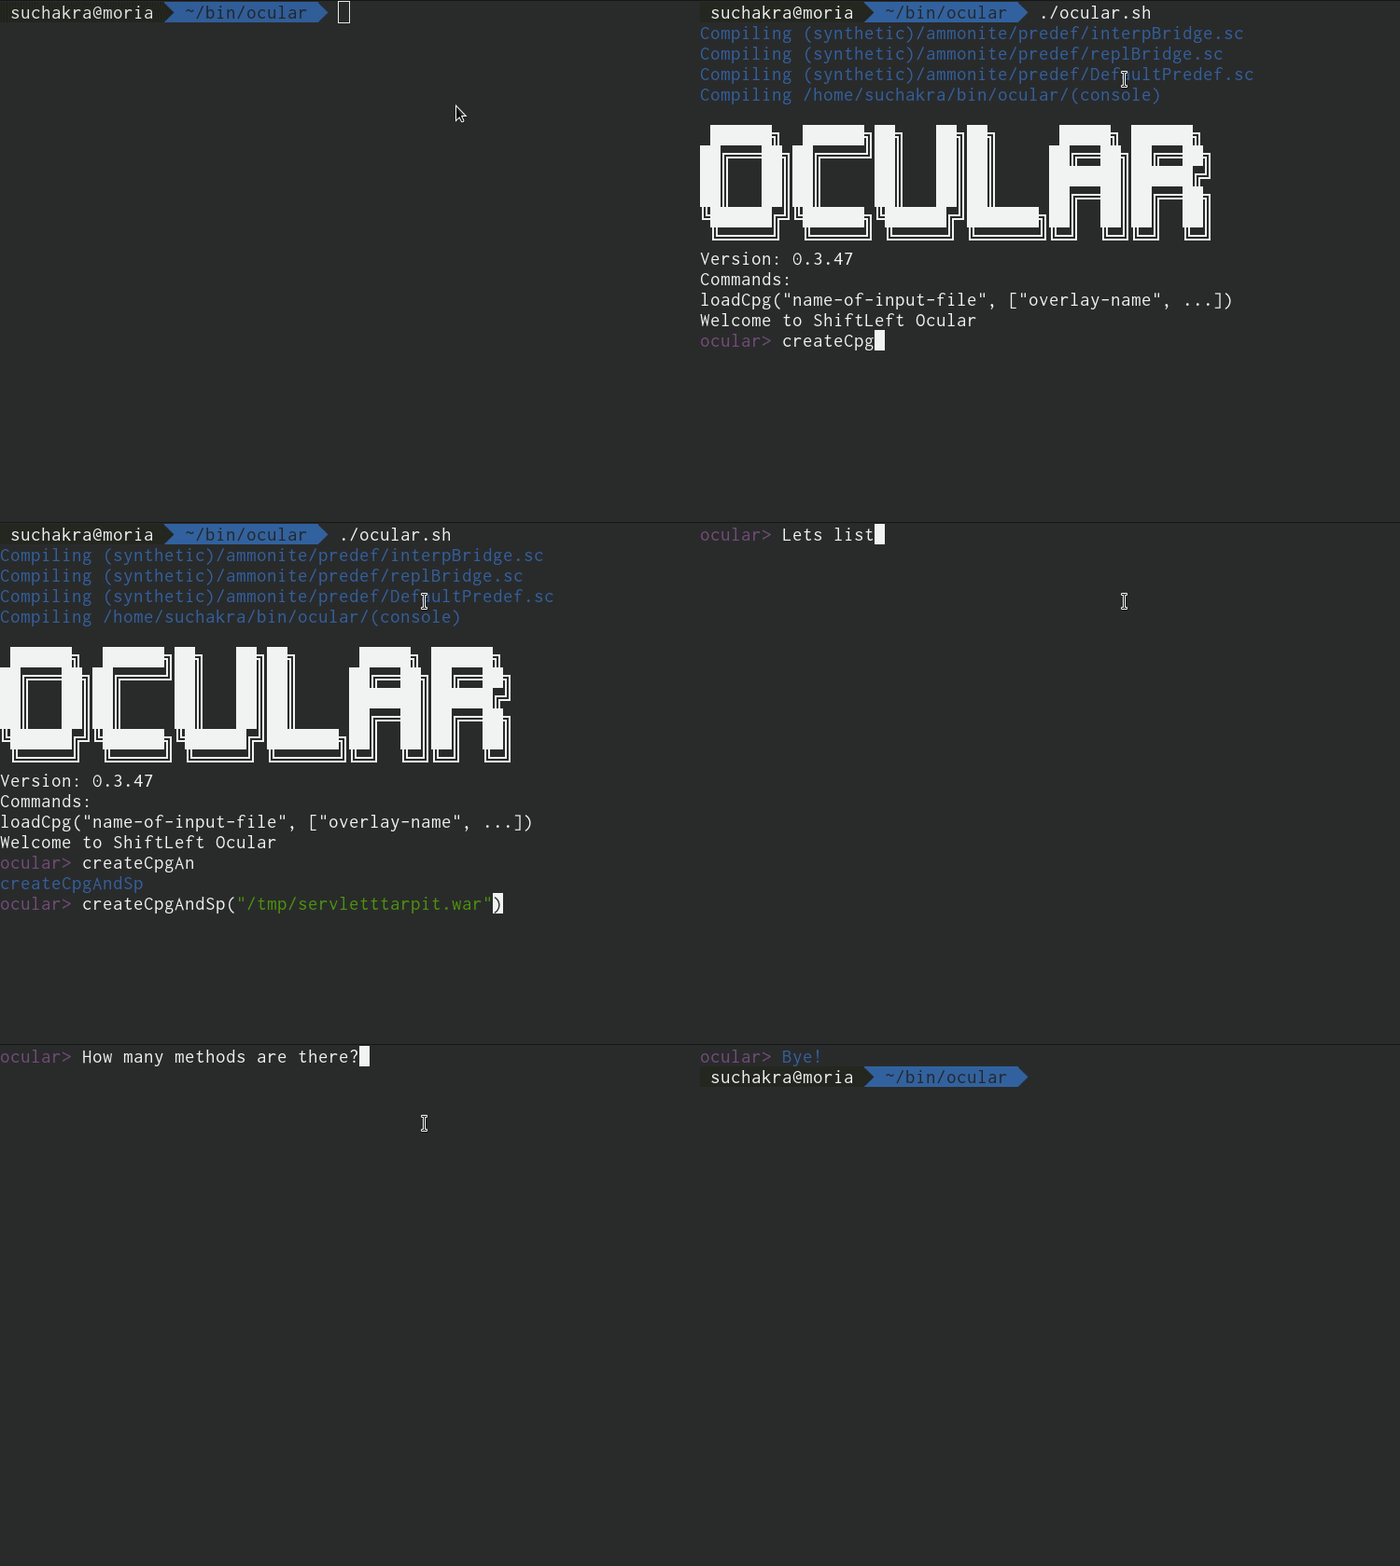
You could really go crazy here – for example, here is me creating a graph of the code and listing all methods in the code in less than a minute:

list-methods


Detecting Allocation Bugs with Ocular/Joern

Lets level up a bit and try to make some simple queries specific to malloc() now. Consider the following piece of code. You could save it and play with it in Ocular or its Open Source brother Joern

#include <stdio.h>
#include <stdlib.h>

int getNumber() {
  int number = atoi("8");
  number = number + 10;
  return number;
}

void *scenario1(int x) {
  void *p = malloc(x);
  return p;
}

void *scenario2(int y) {
  int z = 10;
  void *p = malloc(y * z);
  return p;
}

void *scenario3() {
  int a = getNumber();
  void *p = malloc(a); 
  return p;
}

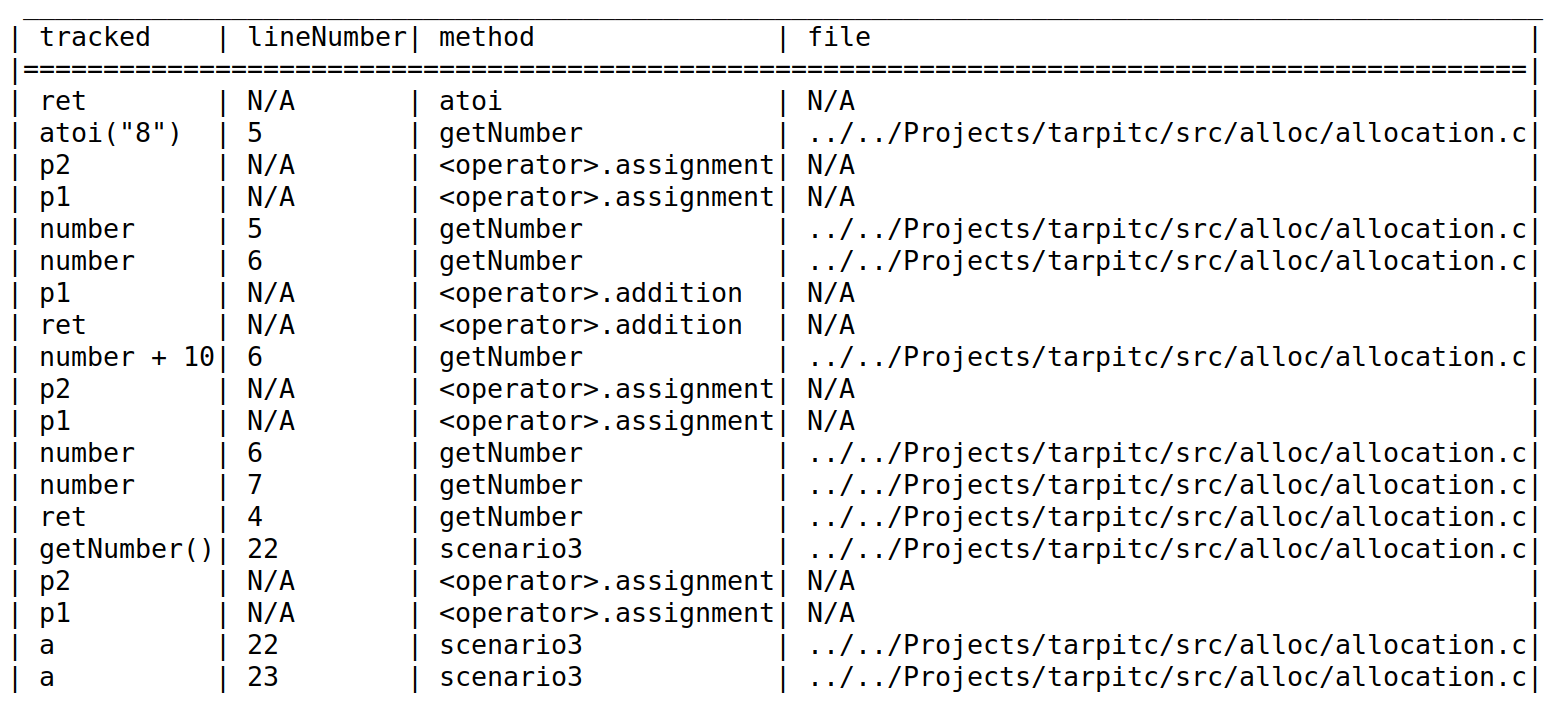
In the code above, lets identify the call-sites of malloc listing the filename and line-numbers. We can formulate it in the following query on the Ocular shell:

Ocular Query:

ocular> cpg.method.callOut.name("malloc").map(x => (x.location.filename, x.lineNumber.get)).l

Result:

List[(String, Integer)] = List(
  ("../../Projects/tarpitc/src/alloc/allocation.c", 23),
  ("../../Projects/tarpitc/src/alloc/allocation.c", 17),
  ("../../Projects/tarpitc/src/alloc/allocation.c", 11)
)

In the sample code, a clear indicator of zero allocation that can happen is scenario2 or scenario3  where arithmetic operations are happening in the data flow leading upto the parameter of malloc call-site. So lets try to formulate a query which lists the data flows with a source as parameters from the “scenario” methods and sinks as all malloc call-sites. We then find all the flows and filter the ones which have an arithmetic operations on the data in the flow. This would be a clear indicator of possibility of zero or incorrect allocation.

Ocular Query:

ocular> val sink = cpg.method.callOut.name("malloc").argument
ocular> var source = cpg.method.name(".*scenario.*").parameter
ocular> sink.reachableBy(source).flows.passes(".*multiplication.*").p

Result:

scenario1

In the query above, we created local variables on Ocular shell called source and sink. The language is scala but as you can see is pretty verbose so I don’t have to explain you much, but still, for the sake of completeness, this is how we can explain the first statement in the Ocular query in English:

To identify the sink, find all call-sites (callOut) for all methods in the graph (cpg) with name as malloc and mark their arguments as sink.

In the code above, these will be x, (y * z) and a. You get the point 😉

Pretty cool, but you would say that this is trivial. Since we are explicitly marking a source method as scenario. Lets level-up a bit now. What if we don’t want to go through all methods and then find if they are vulnerable. What if we could go from any arbitrary call site as source to malloc call site as sink trying to find the data flow on which arithmetic operations are done? We can formulate a query in English where we define a source by first going through all call-sites of all methods, filtering OUT the ones having malloc (sink of interest) and any operation (not interesting), and then making the source as return (methodReturn) of the actual methods of the callsites. In his case, these are ‘atoi’ and ‘getnumber’. Then find data-flows from these sources to the malloc callsite argument as sink which have any arithmetic operation on the data in the flow. Sounds convoluted, but maybe Ocular Query can help explain this more programmatically:

Ocular Query:

ocular> val sink = cpg.method.callOut.name("malloc").argument
ocular> var source = cpg.method.callOut.nameNot(".*(<operator>|malloc).*").calledMethod.methodReturn 
ocular> sink.reachableBy(source).flows.passes(".*(multiplication|addition).*").p

Result:

scenario3

If this in not cool, then I’m outta here. I do not usually endorse technology strongly – because one day we all will die and all this will be someone else’s problem, but if security has to be done properly, this is how you have to do it. You can’t clean-up a flooded basement by pumping out water with buckets while the water drips from the ceiling. And taking hacksurance is the worst way to cop-out im my opinion :-/  You have dig deep and replace the leaking pipes to stop the flood.

Get down in the code and fix yo’ s**t.

In the next blog, I will show how we can make a Double Free Detector in 3 lines of Scala with Ocular/Joern.

Standard
Linux

IRCTC, the lifeline of train ticket booking looks dead from outside

This post is written in collaboration with my friend Srishti Sethi

Ten days ago, one of our friends tried to access the IRCTC website on the east coast (New Jersey) in the United States to book train tickets. But, the site refused to connect. Surprisingly, the website didn’t work on the west coast (San Francisco) as well. After some quick googling, we learned that this might not be a new problem and is quite likely that the website may not have been working for several weeks as someone reported on Tripadvisor. Through this article on Indian Express, we also learned that the website has recently got a revamp 👏Before the overhaul, the site address used to be http://irctc.co.in, but it now is http://irctc.com. Though the main portal page was working, the e-ticketing; one of the inner pages of the site was redirecting to http://irctc.co.in. Our quick speculation was that it is likely due to new changes, there have been some misconfigurations in the server settings which is causing this problem. We downloaded and tried quite a few mobile apps and web services like Cleartrip, Yatri, and Ixigo, but all failed one way or the other. After we failed all our shortcuts, we decided to reach out to the customer care.

Screenshot of email received from IRCTC customer care

We called the customer care several times but we got different and template answers each time (keep refreshing the page, clear cache, etc.) On top of that, IRCTC kept assuring us that they will resolve the issue in 24-48 hours, but we didn’t see any progress.

We were not frustrated that the website was not working for us, but we wanted to get it fixed. To deepen our understanding of the global site availability, we found on Uptrends that the IRCTC is not working in North America and a few regions in Europe. We sent a screenshot showing the details to the customer care and said that we would be willing to help debug the issue further. We wanted to have a more in-depth conversation with someone in the technical department to whom we could explain our learnings and be a bit helpful. But, there wasn’t a provision for that. For a service like IRCTC which is so big, there aren’t departments for handling separate matters, but all in one.

One of us also got a chance to have a quick chat with someone higher-up in the Indian Railways and mentioned to them this problem. Though we sent follow-up emails on their request, our emails themselves became victims of delivery failure. Another senior executive from IRCTC told us that they don’t have the license from the United States to run the site which didn’t make any sense to us. We understand that this is one of the most significant traffic heavy sites, but the customer care experience and technical issues we encountered didn’t entirely justify the popularity it drew through its revamp.

A website as crucial as IRCTC ideally should be a high priority cog in the Railway’s machinery. In 2016-17, 62% of railway ticket reservations were booked online, and just 32% through railway counters. As internet penetration increases, the gap in these numbers will widen further. The goal is, therefore, to have high availability of the website across the world as tourism in India picks up. This July of 2018, IRCTC got 52.52 million hits with 95% traffic from India and 1.36% traffic from the United States which is more than 7 lakh potential tourists and Indian diaspora. It’s not just the loss of customers but also of revenue.

While the customer care calls were going on, to cross verify our earlier speculations, we investigated the issue a bit further. To get an initial sense of what works from where we went to site24x7.com and tried to access http://irctc.co.in from a wide range of regions – selecting many more US specific regions. While the website does work from multiple locations outside India, with the exception of Phoenix, Arizona in the United States, the site was not accessible from all other major cities in US or Canada.

Summary of website availability from across the world. Only Phoenix, AZ worked (Pho)

Surprisingly, the website is also not accessible from Amsterdam as well. While it seems that the DNS was resolved properly and we got a set of 3 IPs for the remote servers, none of them were reachable from within the US. CRIS manages the nameservers and apparently, its website https://cris.org.in is not accessible as well. A bit overkill, but we used Wireshark and saw that the remote server was closing the connection. This could be an indication of a firewall blocking traffic from the US region, or merely a misconfiguration.

A network capture while connecting to IRCTC servers from west coast of US. Sadly they RST 😦

Managing such a large customer volume on any site is indeed a daunting task but not impossible. But if a problem seems to become a broader outage, then here are some recommendations we have:

  • Make the customers aware of the situation through the social media channels or notifications on the site and provide with alternative solutions to proceed with the booking.
  • Adopt a more streamlined customer care flow. Develop more escalation levels and departments that could handle different technical and non-technical queries collaboratively for faster resolution.
  • Large websites have complex monitoring systems available that track usage, statistics, and overall platform health. The MOST crucial statistics are uptime and performance that could be easily tracked by tools such as  Pingdom and Uptime Robot. For example here is how a publicly available status page for Facebook looks like: https://developers.facebook.com/status/dashboard/ and a well-written service outage reported by Slack: https://status.slack.com/2018-06-27.

Even though accessing and booking a ticket through IRCTC is itself a challenge, while we could brush this issue off as it doesn’t seem to impact anyone in India, there are millions of Indians worldwide that still rely on the lifeline of India as it is the only way out to book tickets online.

While we have faith in IRCTC’s engineers, a lack of interest and a chaotic customer response surprised us. We do say Atithi Devo Bhava! but imagine, thousands of atithis trying to access the site every day as they plan their vacation and don’t know what to do further. Those long train rides across the nation in Indian Railways are one of the most enticing memories we have from our childhood. Lets keep this lifeline running!

Also cross-posted here

Standard
Kernel, Linux

So, what’s this AppSwitch thing going around?

I recently read Jérôme Petazzoni’s blog post about a tool called AppSwitch which made some Twitter waves on the busy interwebz. I was intrigued. It turns out that it was something that I was familiar with. When I met Dinesh back in 2015 at Linux Plumbers in Seattle, he had presented me with a grand vision of how applications needs to be free of any networking constraints and configurations and a uniform mechanism should evolve that make such configurations transparent (I’d rather say opaque now). There are layers over layers of network related abstractions. Consider a simple network call made by a java application. It goes through multiple layers in userspace (though the various libs, all the way to native calls from JVM and eventually syscalls) and then multiple layers in kernel-space (syscall handlers to network subsytems and then to driver layers and over to the hardware). Virtualization adds 4x more layers.  Each point in this chain does have a justifiable unique configuration point. Fair point. But from an application’s perspective, it feels like fiddling with the knobs all the time :

christmas_settings

Christmas Settings: https://xkcd.com/1620/

For example, we have of course grown around iptables and custom in-kernel and out of kernel load balancers and even enhanced some of them to exceptional performance (such as XDP based load balancing).  But when it comes to data path processing, doing nothing at all is much better than doing something very efficiently. Apps don’t really have to care about all these myriad layers anyway. So why not add another dimension to this and let this configuration be done at the app level itself? Interesting.. 🤔

I casually asked Dinesh to see how far the idea had progressed and he ended up giving me a single binary and told me that’s it! It seems AppSwitch had been finally baked in the oven.

First Impressions

So there is a single static binary named ax which runs as an executable as well as in a daemon mode. It seems AppSwitch is distributed as a docker image as well though. I don’t see any kernel module (unlike what Jerome tested). This is definitely the userspace version of the same tech.

I used the ax docker image.  ax was both installed and running with one docker-run command.

$ docker run -d --pid=host --net=none -v /usr/bin:/usr/bin -v /var/run/appswitch:/var/run/appswitch --privileged docker.io/appswitch/ax 

Based on the documentation, this little binary seems to do a lot — service discovery, load balancing, network segmentation etc.  But I just tried the basic features in a single-node configuration.

Let’s run a Java webserver under ax.

# ax run --ip 1.2.3.4 -- java -jar SimpleWebServer.jar

This starts the webserver and assigns the ip 1.2.3.4 to it. Its like overlaying the server’s own IP configurations through ax such that all request are then redirected through 1.2.3.4. While idling, I didn’t see any resource consumption in the ax daemon. If it was monitoring system calls with auditd or something, I’d have noticed some CPU activity. Well, the server didn’t break, and when accessed via a client run through ax, it starts serving just fine.

# ax run --ip 5.6.7.8 -- curl -I 1.2.3.4

HTTP/1.0 500 OK
Date: Wed Mar 28 00:19:25 PDT 2018
Server: JibbleWebServer/1.0
Content-Type: text/html
Expires: Thu, 01 Dec 1994 16:00:00 GMT
Content-Length: 58 Last-modified: Wed Mar 28 00:19:25 PDT 2018 

Naaaice! 🙂 Why not try connecting with Firefox. Ok, wow, this works too!

ax-firefox

I tried this with a Golang http server (Caddy) that is statically linked.  If ax was doing something like LD_PRELOAD, that would trip it up. This time I tried passing a name rather than the IP and ran it as regular user with a built-in --user option

# ax run --myserver --user suchakra -- caddy -port 80

# ax run --user suchakra -- curl -I myserver
HTTP/1.1 200 OK
Accept-Ranges: bytes
Content-Length: 0
Content-Type: text/html; charset=utf-8
Etag: "p6f4lv0"
Last-Modified: Fri, 30 Mar 2018 19:25:07 GMT
Server: Caddy
Date: Sat, 31 Mar 2018 01:52:28 GMT

So no kernel module tricks, it seems. I guess this explains why Jerome called it “Network Stack from the future”. The future part here is applications and with predominant containerized deployments, the problems of microservices networking have really shifted near to the apps.

We need to get rid of the overhead caused by networking layers and frequent context switches happening as a single containerized app communicates with another one. AppSwitch could potentially just eliminate this all together and the communication would actually resemble traditional socket based IPC mechanisms with an advantage of a zero overhead read/write cost once the connection is established. I think I would want to test this out thoroughly sometime in the future if i get some time off from my bike trips 🙂

How does it work?

Frankly I don’t know in-depth, but I can guess. All applications, containerized or not, are just a bunch of executables linked to libs (or built statically) running over the OS. When they need OS’s help, they ask. To understand an application’s behavior or to morph it, OS can help us understand what is going on and provide interfaces to modify its behavior. Auditd for example, when configured, can allow us to monitor every syscall from a given process. Programmable LSMs can be used to set per-resource policies through kernel’s help. For performance observability, tracing tools have traditionally allowed an insight into what goes on underneath. In the world of networking, we again take the OS’s help – routing and filtering strategies are still defined through iptables with some advances happening in BPF-XDP. However, in the case of networking, calls such as connect(), accept() could be intercepted purely in userspace as well. But doing so robustly and efficiently without application or kernel changes with reasonable performance has been a hard academic problem for decades [1][2]. There must be some other smart things at work underneath in ax to keep this robust enough for all kinds of apps. With interception problem solved, this would allow ax to create a map and actually perform the ‘switching’ part (which I suppose justifies the AppSwitch name). I have tested it presently on a Java, Go and a Python server. With network syscall interception seemingly working fine, the data then flows like hot knife on butter. There may be some more features and techniques that I may have missed though. Going through ax --help it seems there are some options for egress, WAN etc, but I haven’t played it with that much. 

Some Resources

References

[1] Practical analysis of stripped binary code [link]
[2] Analyzing Dynamic Binary Instrumentation Overhead [link]

Standard
Linux

An entertaining eBPF XDP adventure

In this post, I discuss about the CTF competition track of NorthSec, an awesome security conference and specifically about our tale of collecting two elusive flags that happened to be based upon eBPF XDP technology – something that is bleeding edge and uber cool!

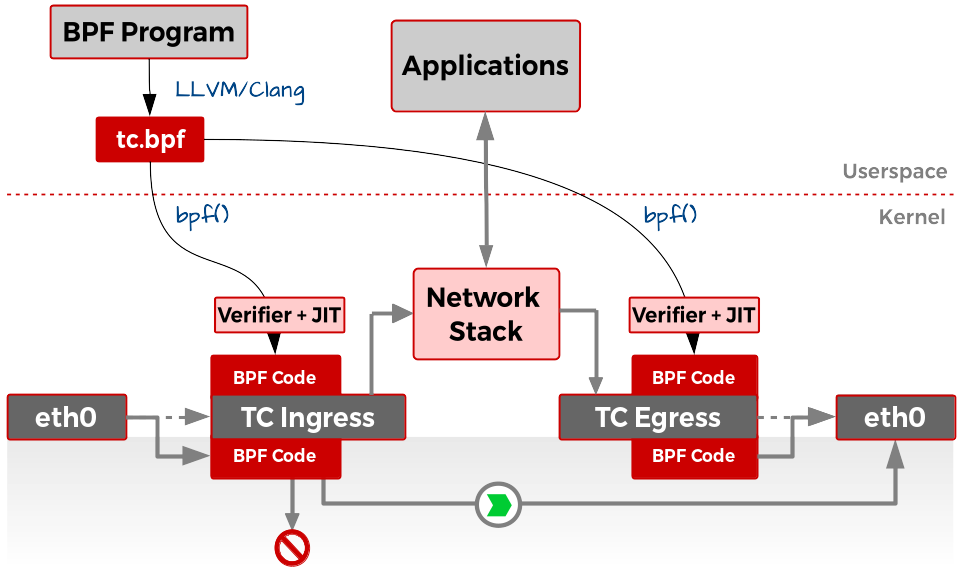
In case you did not know, eBPF eXpress Data Path (XDP) is redefining how network traffic is handled on devices. Filtering, routing and reshaping of incoming packets at a very early stage even before the packets enter the networking stack the other Linux kernel has allowed unprecedented speed and provides a base for applications in security (DDoS mitigation), networking and performance domain. There is a lot of material from Quentin Monnet, Julia Evans, Cilium and IOVisor projects, about what eBPF/XDP is capable of. For the uninitiated, generic information about eBPF can also be found on Brendan Gregg’s eBPF page and links. If you think you want to get serious about this, here are some more links and detailed docs. In a recent talk I gave, I showed a diagram similar to the one below – as I started teasing myself on the possible avenues beyond the performance monitoring and tracing usecase that is dear to my heart :

cls-xdp

TC with cls_bpf and XDP. Actions on packet data is taken at the driver level in XDP

The full presentation is here. So, what’s interesting here is that the incoming packets from the net-device can now be statefully filtered or manipulated even before they reach the network stack. This has been made possible by the use of extended Berkeley Packet Filter (eBPF) programs which allows such low-level actions at the driver level to be flexibly programmed in a safe manner from the userspace. The programming is done in a restricted-C syntax that gets compiled to BPF bytecode by LLVM/Clang. The bpf() syscall then allows the bytecode to be sent to the kernel at proper place – here, these are the ‘hooks’ at ingress and egress of raw packets. Before getting attached, the program goes through a very strict verifier and an efficient JIT compiler that converts the BPF programs to native machine code (which is what makes eBPF pretty fast) Unlike the register struct context for eBPF programs attached to Kprobes, the context passed to the XDP eBPF programs is the XDP metadata struct. The data is directly read and parsed from within the BPF program, reshaped if required and an action taken for it. The action can be either XDP_PASS, where it is passed to the network stack as seen in the diagram, or XDP_DROP, where it dropped by essentially sending it back to the driver queue and XDP_TX which sends the packets back to the NIC they came from. While the packet PASS and DROP can be a good in scenarios such as filtering IPs, ports and packet contents, the TX usecase is more suited for load balancing where the packet contents can be modified and transmitted back to the NIC. Currently, Facebook is exploring its use and presented their load balancing and DDoS prevention framework based on XDP in the recent Netdev 2.1 in Montreal. Cilium Project is another example of XDP’s use in container networking and security and is an important project resulting from the eBPF tech.

NorthSec BPF Flag – Take One

Ok, enough of XDP basics for now. Coming back to the curious case of a fancy CTF challenge at NorthSec, we were presented with a VM and told that “Strange activity has been detected originating from the rao411 server, but our team has been unable to understand from where the commands are coming from, we need your help.” It also explicitly stated that the machine was up-to-date Ubuntu 17.04 with an unmodified kernel. Well, for me that is a pretty decent hint that this challenge would require kernel sorcery. Simon checked the /var/log/syslog and saw suspicions prints every minute or two that was causing the /bin/true command to run. Pretty strange. We sat together and still tried to use netcat to listen to network chatter on multiple ports as we guessed that something was being sent from outside to the rao411 server.  Is it possible that the packets were somehow being dropped even before they reached the network stack? We quickly realized that what we were seeing was indeed related to BPF as we saw some files lying around in the VM which looked like these (post CTF event, Julien Desfossez, who designed the challenge has been generous enough to provide the code, which itself is based on Jesper Dangaard Brouer’s code in the kernel source tree) As we see, there are the familiar helper functions used for loading BPF programs and manipulating BPF maps. Apart from that, there was the xdp_nsec_kern.c file which contained the BPF program itself! A pretty decent start it seems 🙂 Here is the code for the parse_port() function in the BPF XDP program that is eventually called when a packet is encountered :


u32 parse_port(struct xdp_md *ctx, u8 proto, void *hdr)
{
void *data_end = (void *)(long)ctx->data_end;
struct udphdr *udph;
u32 dport;
char *cmd;
unsigned long payload_offset;
unsigned long payload_size;
char *payload;
u32 key = 0;

if (proto != IPPROTO_UDP) {
return XDP_PASS;
}

udph = hdr;
if (udph + 1 > data_end) {
return XDP_ABORTED;
}

payload_offset = sizeof(struct udphdr);
payload_size = ntohs(udph->len) - sizeof(struct udphdr);

dport = ntohs(udph->dest);
if (dport == CMD_PORT + 1) {
return XDP_DROP;
}

if (dport != CMD_PORT) {
return XDP_PASS;
}

if ((hdr + payload_offset + CMD_SIZE) > data_end) {
return XDP_ABORTED;
}
cmd = bpf_map_lookup_elem(&nsec, &key);
if (!cmd) {
return XDP_PASS;
}
memset(cmd, 0, CMD_SIZE);
payload = &((char *) hdr)[payload_offset];
cmd[0] = payload[0];
cmd[1] = payload[1];
cmd[2] = payload[2];
cmd[3] = payload[3];
cmd[4] = payload[4];
cmd[5] = payload[5];
cmd[6] = payload[6];
cmd[7] = payload[7];
cmd[8] = payload[8];
cmd[9] = payload[9];
cmd[10] = payload[10];
cmd[11] = payload[11];
cmd[12] = payload[12];
cmd[13] = payload[13];
cmd[14] = payload[14];
cmd[15] = payload[15];

return XDP_PASS;
}

Hmmm… this is a lot of information. First, we observe that the destination port is extracted from the UDP header by the BPF program and the packets are only passed if the destination port is CMD_PORT (which turns out to be 9000 as defined in the header xdp_nsec_common.h). Note that the XDP actions are happening too early, hence even if we were to listen at port 9000 using netcat, we would not see any activity. Another pretty interesting thing is that some payload from the packet is being used to prepare a cmd string. What could that be? Why would somebody prepare a command from a UDP packet? 😉

Lets dig deep. So, the /var/log/syslog was saying that it is executing xdp_nsec_cmdline intermittently and executing /bin/true. Maybe there is something in that file? A short glimpse of xdp_nsec_cmdline.c confirms our line of thought! Here is the snippet from its main function :

int main(int argc, char **argv)
{
.
.
    cmd = malloc(CMD_SIZE * sizeof(char));
    fd_cmd = open_bpf_map(file_cmd);

    memset(cmd, 0, CMD_SIZE);
    ret = bpf_map_lookup_elem(fd_cmd, &key, cmd);
    printf("cmd: %s, ret = %d\n", cmd, ret);
    close(fd_cmd);
    ret = system(cmd);
.
.
}

The program opens the pinned BPF map file_cmd (which actually is /sys/fs/bpf/nsec) and looks up the value stored and executes it. Such Safe. Much Wow. It seems we are very close. We just need to craft a UDP packet which then updates the map with the command in payload. The first flag was a file called flag which was not accessible by the logged in raops user. So we just made a script in /tmp which changed permission for that file and sent the UDP packet containing our script.

Trivia! Bash has an alias to send UDP packets :
echo -n "/tmp/a.sh" >/dev/udp//9000 

So, we now just had to wait for the program to run the xdp_nsec_cmdline which would trigger our script. And of course it worked! We opened the flag and submitted it. 6 points to InfoSecs!

NorthSec BPF Flag – Take Two

Of course, our immediate action next was to add raops user to /etc/sudoers 😉 Once we had root access, we could now recompile and re-insert the BPF program as we wished. Simon observed an interesting check in the BPF XDP program listed above that raised our brows :

...
    if (dport == CMD_PORT + 1) {
        return XDP_DROP;
    }

    if (dport != CMD_PORT) {
        return XDP_PASS;
    }
...

Why would someone want to drop the packets coming at 9001 explicitly? Unless..there was a message being sent on that port from outside! While not an elegant approach, we just disabled the XDP_DROP check so that the packet would reach the network stack and we could just netcat the data on that port. Recompile, re-insert and it worked! The flag was indeed being sent on 9001 which was no longer dropped now. 8 points to InfoSecs!

Mandatory cool graphic of us working

I really enjoyed this gamification of advanced kernel tech as it increases its reach to the young folks interested in Linux kernel internals and modern networking technologies. Thanks to Simon Marchi for seeing this through with me and Francis Deslauriers for pointing out the challenge to us! Also, the NorthSec team (esp. Julien Desfossez and Michael Jeanson) who designed this challenge and made the competition more fun for me! Infact Julien started this while watching the XDP talks at Netdev 2.1. Also, thanks to the wonderful lads Marc-Andre, Ismael, Felix, Antoine and Alexandre from University of Sherbrooke who kept the flag chasing momentum going 🙂 It was a fun weekend! That’s all for now. If I get some more time, I’d write about an equally exciting LTTng CTF (Common Trace Format) challenge which Simon cracked while I watched from the sidelines.

EDIT : Updated the above diagram to clarify that XDP filtering happens early at the driver level – even before TC ingress and egress. TC with cls_bpf also allows BPF programs to be run. This was indeed a precursor to XDP.

Standard
Linux

Analyzing KVM Hypercalls with eBPF Tracing

I still visit my research lab quite often. It’s always nice to be in the zone where boundaries of knowledge are being pushed further and excitement is in the air. I like this ritual as this is a place where one can discuss linux kernel code and philosophy of life all in a single sentence while we quietly sip our hipster coffee cups.

In the lab, Abder is working these days on some cool hypercall stuff. The exact details of his work are quite complex, but he calls his tool hypertrace. I think I am sold on the name already. Hypercalls are like syscalls, but instead of such calls going to a kernel, they are made from guest to the hypervisor with arguments and an identifier value (just like syscalls). The hypervisor then brokers the privileged operation for the guest. Pretty neat. Here is some kernel documentation on hypercalls.

So Abder steered one recent discussion towards internals of KVM and wanted to know the latency caused by a hypercall he was introducing for his experiments (as I said he is introducing new hypercall with an id – for example 42). His analysis usecase was quite specific – he wanted to trace the kvm_exit -> kvm_hypercall -> kvm_entry sequence to know the exact latency he was causing for a given duration. In addition the tracing overhead needs to be minimum and is for a short duration only. This is somewhat trivial. These 3 tracepoints are there in the kernel already and he could latch on to them. Essentially, he needs to look for exit_reason argument of the kvm_exit tracepoint and it should be a VMCALL (18), which would denote that a hypercall is coming up next. Then he could look at the next kvm_exit event and find the time-delta to get the latency. Even though it is possible by traditional tracing such as LTTng and Ftrace to record events, Abder was only interested in his specific hypercall (nr = 42) along with the kvm_exit that happened before (with exit_reason = 18) and kvm_entry after that. This is not straightforward. It’s not possible to do such specific tracing with traditional tracers at a high speed and low overhead. This means the selection of events should not just be a simple filter, but should be stateful. Just when Abder was about to embark on a journey of kprobes and kernel modules, I once more got the opportunity of being Morpheus and said “What if I told you…

The rest is history. (dramatic pause)

Jokes apart, here is a small demo of eBPF/BCC script that allows us to hook onto the 3 aforementioned tracepoints in the Linux kernel and conditionally record the trace events:

from __future__ import print_function
from bcc import BPF

# load BPF program
b = BPF(text="""
#define EXIT_REASON 18
BPF_HASH(start, u8, u8);

TRACEPOINT_PROBE(kvm, kvm_exit) {
    u8 e = EXIT_REASON;
    u8 one = 1;
    if (args->exit_reason == EXIT_REASON) {
        bpf_trace_printk("KVM_EXIT exit_reason : %d\\n", args->exit_reason);
        start.update(&e, &one);
    }
    return 0;
}

TRACEPOINT_PROBE(kvm, kvm_entry) {
    u8 e = EXIT_REASON;
    u8 zero = 0;
    u8 *s = start.lookup(&e);
    if (s != NULL && *s == 1) {
        bpf_trace_printk("KVM_ENTRY vcpu_id : %u\\n", args->vcpu_id);
        start.update(&e, &zero);
    }
    return 0;
}

TRACEPOINT_PROBE(kvm, kvm_hypercall) {
    u8 e = EXIT_REASON;
    u8 zero = 0;
    u8 *s = start.lookup(&e);
    if (s != NULL && *s == 1) {
        bpf_trace_printk("HYPERCALL nr : %d\\n", args->nr);
    }
    return 0;
};
""")

# header
print("%-18s %-16s %-6s %s" % ("TIME(s)", "COMM", "PID", "EVENT"))

# format output
while 1:
    try:
        (task, pid, cpu, flags, ts, msg) = b.trace_fields()
    except ValueError:
        continue

    print("%-18.9f %-16s %-6d %s" % (ts, task, pid, msg))

The TRACEPOINT_PROBE() interface in BCC allows us to use static tracepoints in the kernel. For example, whenever a kvm_exit occurs in the kernel, the first probe is executed and it records the event if the exit reason was VMCALL. At the same time it updates a BPF hash map, which basically acts like a flag here for other events. I recommend you to check out Lesson 12 from the BCC Python Developer Tutorial if this seems interesting to you 🙂 In addition, perhaps the reference guide lists the most important C and Python APIs for BCC.

To test the above example out, we can introduce our own hypercall in the VM using this small test program :

#define do_hypercall(nr, p1, p2, p3, p4) \
__asm__ __volatile__(".byte 0x0F,0x01,0xC1\n"::"a"(nr), \
    "b"(p1), \
    "c"(p2), \
    "d"(p3), \
    "S"(p4))

void main()
{
    do_hypercall(42, 0, 0, 0, 0);
}

While the BPF program is running, if we do a hypercall, we get the following output :

TIME(s)            COMM             PID    EVENT
1795.472072000     CPU 0/KVM        7288   KVM_EXIT exit_reason : 18
1795.472112000     CPU 0/KVM        7288   HYPERCALL nr : 42
1795.472119000     CPU 0/KVM        7288   KVM_ENTRY vcpu_id : 0

So we see how in a few minutes we could precisely gather only those events that were of interest to us – saving us from the hassle of setting up other traces or kernel modules. eBPF/BCC based analysis allowed us to conditionally trace only a certain subsection of events instead of the huge flow of events that we would have had to analyze offline. KVM  internals are like a dark dungeon and I feel as if I am embarking on a quest here. There are a lot more upcoming KVM related analysis we are doing with eBPF/BCC. Stay tuned for updates! If you find any more interesting usecases for eBPF in the meantime, let me know. I would love to try them out! As always, comments, corrections and criticisms are welcome.

Standard
GDB, Linux

Unravelling Code Injection in Binaries

It seems pretty surreal going through old lab notes again. It’s like a time capsule – an opportunity to laugh at your previous stupid self and your desperate attempts at trying to rectify that situation. My previous post on GDB’s fast tracepoints and their clever use of jump-pads longs for a more in-depth explanation on what goes on when you inject your own code in binaries.

Binary Instrumentation

The ability to inject code dynamically in a binary – either executing or on disk gives huge power to the developer. It basically eliminates the need of source code and re-compilation in most of the cases where you want to have your own small code run in a function and which may change the flow of program. For example, a tiny tracer that counts the number of time a certain variable was assigned a value of 42 in a target function. Through binary instrumentation, it becomes easy to insert such tiny code snippets for inexpensive tracing even in production system and then safely remove them once we are done – making sure that the overhead of static tracepoints is avoided as well. Though a very common task in security domain, binary instrumentation also forms a basis for debuggers and tracing tools. I think one of the most interesting study material to read from an academic perspective is Nethercote’s PhD Thesis. Through this, I learnt about the magic of Valgrind (screams for a separate blog post), the techniques beyond breakpoints and  trampolines. In reality, most of us may not usually look beyond ptrace() when we hear about playing with code instrumentation. GDB’s backbone and some of my early experiments for binary fun have been with ptrace() only. While Eli Bendersky explains some of the debugger magic and the role of ptrace() in sufficient detail, I explore more on what happens when the code is injected and it modifies the process while it executes.

Primer

The techniques for binary instrumentation are numerous. The base of all the approaches is the ability to halt the process,identify an instrumentation point (a function, an offset from function start, an address etc.), modify its memory at that point, execute code and rewrite/restore registers. For on-disk dynamic instrumentation, the ability to load the binary, parse, disassemble and patch it with instrumentation code is required. There are then multiple ways to insert/patch the binary. In all these ways, there is always a tradeoff between overhead (size and the added time due to extra code added), control over the binary (how much and where can we modify) and robustness (what if the added code makes the actual execution unreliable – for example, loops etc.). From what I have understood from my notes, I basically classify ways to go about code patching. There may be more crazy ones (such as those used in viruses) but for tracing/debugging tools most of them are as follows :

  • TRAP Based : I already discussed this in the last post with GDB’s normal tracepoints. Such a technique is also used in older non-optimized Kprobes. An exception causing instruction (such as int 3) is inserted at the desired point and its handler calls the code which you want to execute. Pretty standard stuff.
  • JIT Recompilatin Based : This is something more interesting and is used by Valgrind. The binary is first disassembled, and converted to an intermediate representation (IR). Then IR is instrumented with the analysis code from the desired Valgrind tool (such as memcheck). The code is recompiled, stored in a code-cache and executed on a ‘synthetic CPU’. This is like JIT compilation but applied to analysis tools. The control over the information that can be gathered in such cases is very high, but so is the overhead (can go from 4x-50x slower in various cases).
  • Trampoline Based : Boing! Basically, we just patch the location with a jump to a jump-pad or trampoline (different name for same thing). This trampoline can execute the displaced instructions and then prepare another jump to the instrumented code and then back to the actual code. This out-of-line execution maintains sufficient speed, reduced overhead as no TRAP, context switch or handler call is involved. Many binary instrumentation frameworks such as Dyninst are built upon this. We will explain this one in further detail.

Dyninst’s Trampoline

Dyninst’s userspace-only trampoline approach is quite robust and fast. It has been used in performance analysis tools such as SystemTap, Vampir and Tau and hence a candidate for my scrutiny. To get a feel of what happens under the hood, lets have a look at what Dyninst does to our code when it patches it.

Dyninst provides some really easy to use APIs to do the heavy lifting for you. Most of them are very well documented as well. Dyninst introduces the concept of mutator which is the program that is supposed to modify the target or mutatee. This mutatee can either be a running application or a binary residing on disk. The process attaching or creating a new target process allows the mutator to control the execution of the mutatee. This can be achieved by either processCreate() or processAttach(). The mutator then gets the program image using the object, which is a static representation of the mutatee. Using the program image, the mutator can identify all possible instrumentation points
in the mutatee. The next step is creating a snippet (or the code you want to insert) for insertion at the identified point. The mutator can then create a snippet, to be inserted into the mutatee. Building small snippets can be trivial. For example, small snippets can be defined using the BPatch arithExpr and BPatch varExp types. Here is a small sample. The snippet is compiled into machine language and copied into the application’s address space. This is easier said than done though. For now, we just care about how the snippet affects our target process.

Program Execution flow

The Dyninst API inserts this compiled snippet at the instrumentation points. Underneath is the familiar ptrace() technique of pausing and poking memory. The instruction at the instrumentation point is replaced by a jump to a base trampoline. The base trampoline then jumps to a mini-trampoline that starts by saving any registers that will be modified. Next, the instrumentation is executed. The mini-trampoline then restores the necessary registers, and jumps back to the base trampoline. Finally, the base trampoline executes the replaced instruction and jumps back to the instruction after the instrumentation point. Here is a relevant figure taken from this paper :

dyninst-working

As part of some trials, I took a tiny piece of code and inserted a snippet at the end of the function foo(). Dyninst changed it to the following :

dyninst-jmp

Hmm.. interesting. So the trampoline starts at 0x10000 (relative to PC). Our instrumentation point was intended to be function exit. It means Dyninst just replaces the whole function in this case. Probably it is safer this way rather than replacing a single or a small set of instructions mid function. Dynisnt’s API check for many other things when building the snippet. For example, we need to see if the snippet contains code that recursively calls itself causing the target program to stop going further. More like a verifier of code being inserted (similar to eBPF’s verifier in Linux kernel which checks for loops etc before allowing the eBPF bytecode execution). So what is the trampoline doing? I used GDB to hook onto what is going on and here is a reconstruction of the flow :

dyninst-mod

Clearly, the first thing the trampoline does is execute the remaining function out of line, but before returning, it start preparing the snippet’s execution. The snippet was a pre-compiled LTTng tracepoint (this is a story for another day perhaps) but you don’t have to bother much. Just think of it as a function call to my own function from within the target process. First the stack is grown and the machine registers are pushed on to the stack so that we can return to the state where we were after we have executed the instrumented code. Then it is grown further for snippet’s use. Next, the snippet gets executed (the gray box) and the stack is shrunk back again to the same amount. The registers pushed on the stack are restored along with the original stack pointer and we return as if nothing happened. There is no interrupt, no context-switch, no lengthy diversions. Just simple userspace code 🙂

So now we know! You can use Dyninst and other such frameworks like DynamoRIO or PIN to build your own tools for tracing and debugging. Playing with such tools can be insane fun as well. If you have any great ideas or want me to add something in this post, leave a comment!

Standard
GDB, Linux

Fast Tracing with GDB

Even though GDB is a traditional debugger, it provides support for dynamic fast user-space tracing. Tracing in simple terms is super fast data logging from a target application or the kernel. The data is usually a superset of what a user would normally want from debugging but cannot get because of the debugger overhead. The traditional debugging approach can indeed alter the correctness of the application output or alter its behavior. Thus, the need for tracing arises. GDB in fact is one of the first projects which tried to have an integrated approach of debugging and tracing using the same tool. It has been designed in a manner such that sufficient decoupling is maintained – allowing it to expand and be flexible. An example is the use of In-Process Agent (IPA) which is crucial to fast tracing in GDB but is not necessary for TRAP-based normal tracepoints.

GDB’s Tracing Infrastructure

The tracing is performed by trace and collect commands. The location where the user wants to collect some data is called a tracepoint. It is just a special type of breakpoint without support of running GDB commands on a tracepoint hit. As the program progresses, and passes the tracepoint, data (such as register values, memory values etc) gets collected based on certain conditions (if desired so). The data collection is done in a trace buffer when the tracepoint is hit. Later, that data can be examined from the collected trace snapshot using tfind. However, tracing for now is restricted to remote targets (such as gdbserver). Apart from this type of dynamic tracing, there is also support for static tracepoints in which instrumentation points known as markers are embedded in the target and can be activated or deactivated.  The process of installing these static tracepoints is known as probing a marker. Considering that you have started GDB and your binary is loaded, a sample trace session may look something like this :


(gdb) trace foo
(gdb) actions
Enter actions for tracepoint #1, one per line.
> collect $regs,$locals
> while-stepping 9
> collect $regs
> end
> end
(gdb) tstart
[program executes/continues...]
(gdb) tstop

This puts up a tracepoint at foo, collects all register values at tracepoint hit, and then for subsequent 9 instruction executions, collects all register values. We can now analyze the data using tfind or tdump.


(gdb) tfind 0
Found trace frame 0, tracepoint 1
54    bar    = (bar & 0xFF000000) >> 24;

(gdb) tdump
Data collected at tracepoint 1, trace frame 0:
rax    0x2000028 33554472
rbx    0x0 0
rcx    0x33402e76b0 220120118960
rdx    0x1 1
rsi    0x33405bca30 220123089456
rdi    0x2000028 33554472
rbp    0x7fffffffdca0 0x7fffffffdca0
rsp    0x7fffffffdca0 0x7fffffffdca0
.
.
rip    0x4006f1 0x4006f1 <foo+7>
[and so on...]

(gdb) tfind 4
Found trace frame 4, tracepoint 1
0x0000000000400700 55    r1 = (bar & 0x00F00000) >> 20;

(gdb) p $rip
$1 = (void (*)()) 0x400700 <foo+22>

So one can observe data collected from different trace frames in this manner and even output to a separate file if required. Going more in depth to know how tracing works, lets see the GDB’s two tracing mechanisms :

Normal Tracepoints

These type of tracepoints are the basic default tracepoints. The idea of their use is similar to breakpoints where GDB replaces the target instruction with a TRAP or any other exception causing instruction. On x86, this can usually be an int 3 which has a special single byte instruction – 0xCC reserved for it. Replacing a target instruction with this 1 byte ensures that the normal instructions are not corrupted. So, during the execution of the process, the OS hits the int 3 where it halts and program state is saved. The OS sends a SIGTRAP signal to the process. As GDB is attached or is running the process, it receives a SIGCHLD as a notification, that something happened with a child. It does a wait(), which will tell it that process has received a SIGTRAP. Thus the SIGTRAP never reaches the process as GDB intercepts it. The original instruction is first restored, or executed out-of-line for non-stop multi-threaded debugging. GDB transfers the control to the trace collection which does the data collection part upon evaluating any condition set. The data is stored into a trace buffer. Then, the original instruction is replaced again with the tracepoint and normal execution continues. This all fine and good, but there is a catch – the TRAP mechanism alters the flow of the application and the control is passed to the OS which leads to some delay a compromise in speed. But even with that, because of a very restrictive conditional tracing design, and better interaction of interrupt-driven approaches with instruction caches, normal interrupt- based tracing in GDB is a robust technique. A faster solution would indeed be a pure user-space approach, where everything is done at the application level.

Fast Tracepoints

Owing to the limitations stated above, a fast tracepoint approach was developed. This special type of tracepoint uses a dynamic tracing approach. Instead of using the breakpoint approach, GDB uses a mix of IPA and remote target (gdbserver) to replace the target instruction with a 5 byte jump to a special section in memory called a jump-pad. This jump-pad, also known as a trampoline, first pushes all registers to stack (saving the program state). Then, it calls the collector  function for trace data collection, it executes the displaced instruction out-of-line, and jumps back to the original instruction stream. I will probably write something more about how trampolines work and some techniques used in dynamic instrumentation frameworks like Dyninst in a subsequent post later on.

gdb-working

Fast tracepoints can be used with command ftrace, almost exactly like with the trace command. A special command in the following format is sent to the In-Process Agent by gdbserver as,

FastTrace:<tracepoint_object><jump_pad>

where <tracepoint object> is the object containing bytecode for conditional tracing, address, type, action etc. and <jump pad> is the 8-byte long head of the jump pad location in the memory. The IPA prepares all that and if all goes well, responds to such a  query by,

OK<target_address><jump_pad><fjump_size><fjump>

where <target address> is the address where the tracepoint is put in the inferior, <jump_pad> is the updated address of the jump pad head and the <fjump> and <fjump_size> are the jump instruction sequence and its size copied to the command buffer, sent back by IPA. The remote target (gdbserver) then modifies the memory of the target process. Much more fine grained information about fast tracepoint installation is available in the GDB documentation. This is a very pure user-space approach to tracing. However, there is a catch – the target instruction to be replaced should be at least 5 bytes long for this to work as the jump is itself 5 byte long (on Intel x86). This means that fast tracepoints using GDB cannot be put everywhere. How code is modified when patching a 5 bytes instruction is a discussion of another time. This is probably the fastest way yet to perform dynamic tracing and is a good candidate for such work.

The GDB traces can be saved with tsave and with the –ctf switch may be exported to CTF also. I have not tried this but hopefully it should at least open the traces with TraceCompass for further analysis. The GDB’s fast tracepoint mechanism is quite fast I must say – but in terms of usability, LTTng is a far better and advanced option. GDB however allows dynamic insertion of tracepoints and the tracing features are well integrated in your friendly neighborhood debugger. Happy Tracing!

Standard