I recently gave a talk at Storage Developers Conference 2020 in the Filesystems Track with my colleague Hani Nemati. For this talk, I chose to use the only technique I know (tracing) and hammer the Linux FS subsystem as much as possible to understand some specific areas of it that I’ve left unexplored. Here is one question that I asked Hani – how does read-ahead mechanism work in the kernel? For those not familiar with what read-ahead is, let me try to explain it.

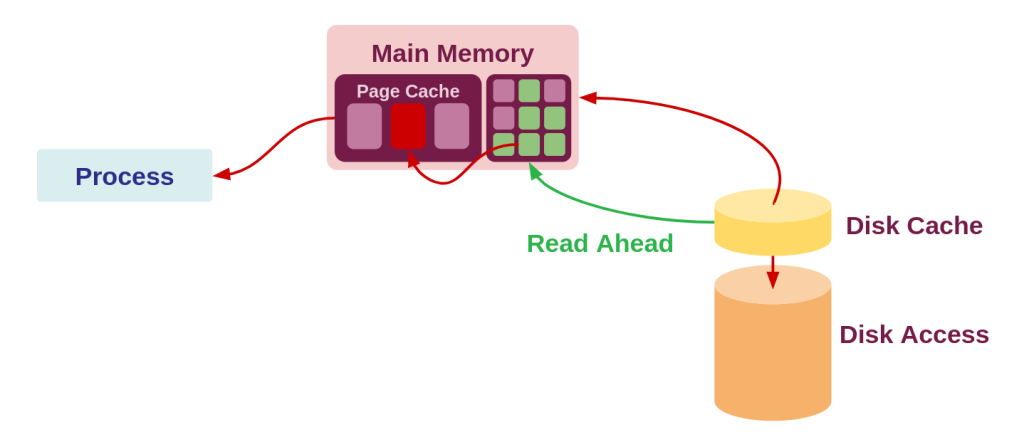
Consider an app that performs streaming/buffered read operations. A way to improve its performance is to ensure that, (1) we use a cache, (2) we fill that cache with prefetched data that we know the process would be requesting in the following moments and (3) we free the cached data upon touching it so more of the streaming data can fill it. This would probably avoids lots of cache misses and hence improves the performance. As you can see, this is a special case of performance gains. And of course, the decision of when the read-ahead mechanism in kernel should kick in is depending a lot on heuristics. Naturally, such over-optimizations for very specific cases of application IO profiles can actually damage read performance for the normal cases. This was also noted in a discussion 10 years back on LWN. For example, for some older USB memory drives, since the read performance can be slow, and the buffers will remain filled most of the time, and hence having a large read-ahead buffer could actually hamper the performance since the data may be paged out frequently thereby increasing the overall IO latency. Modern read-ahead is quite awesome though. To know more about how read-ahead triggering decisions are made, read the kernel code. The algorithm is called as “On-demand readahead” and is quite interesting. The Linux kernel does allow the userspace application to “advise” it instead of completely autonomously taking over all the time. And so, says the userspace to the kernel:
Hey mate, we are about to do a sequential read, tune your gears for this task, eh?
This is usually done using the MADV_SEQUENTIAL flag set in the madvise() or fadvise() syscall. There is another older syscall available as well, aptly named readahead() which basically performs the same technique directly. The Linux Test Project even maintains a micro-benchmark for testing its performance. Could be super interesting to actually use this to test on multiple disk types!
Coming back to the task at hand now. The goal of this post is to develop a tool to precisely measure if the read-ahead mechanism you may be loving so much is actually working for your specific workload or not? What if your NodeJS app uses a file operations module that has a transitive 5 layer deep dependency which leads to a native buffered read which is perhaps not using read-ahead the way it should be? The simple way is to make a tool that precisely does that this for a given process:
- Track how many pages are in the read-ahead cache
- How long have those pages stayed in the cache
- At any given time, how many have been left untouched
So, if you are of the impatient kind, a CLI tool exactly for this very specific task does exist! It was written by Brendan Gregg in bpftrace lingo and is called as readahead. You could also read about it in his BPF Performance Tools Book. Infact, Hani and I started making it from scratch but found out it was already there so this has been of immense help in understanding what is going on under the hood! However, we decided to port it to BCC and also give it some visualizations with Grafana. Another recent variant of the tool also exists and uses the new libbpf directly (which is now the recommended way to write BPF tracing tools according to Brendan:
And so, this is what the post is about – understanding how such a tool can be built with eBPF and how we can extend it to create nice auto-updating visualizations! We will look at both ways – the old (BCC Python/C) and the new (libbpf/CO-RE C) and learn how such tools can be built.
Tracking Read-ahead in Kernel
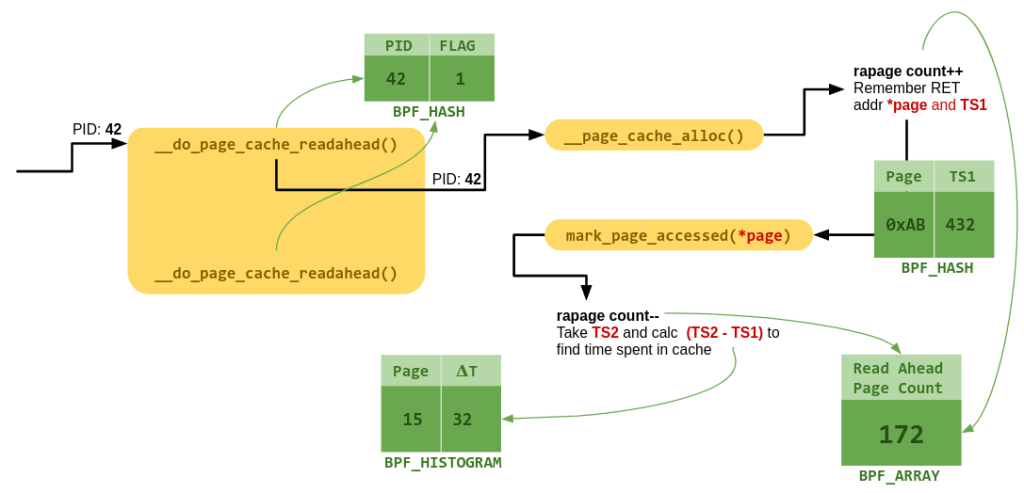
So the first task is to understand when read-ahead actually happens. To understand this, we go to filemap_fault() function. This is called from within a pagefault when there is a memory mapped region being used. Assuming page does not exist in the cache, it calls do_sync_mmap_readahead() from where we eventually call page_cache_sync_readahead() which is actually here. This is called when the vma has VM_SEQ_READ flag set. This is infact, based on our advice from userspace process before! Seems like we are getting close. This function then calls the actual read-ahead decision algorithm ondemand_readahead() which we talked about before. The algorithm makes some decisions and when it’s time to submit a readahead request it calls the __do_page_cache_readahead() function which actually reads the chunk of data from disk to the cache. It does so via allocating multiple pages with __page_cache_alloc() and then filling them up. So it seems we have reached the point where we have some idea what to track to fulfill our needs for this tool. One thing that is still remaining is to track if one of those pages that we just allocated have been accessed or not to see if the readahead cache is utilized properly. This is quite simple – each page that is accessed is marked by mark_page_accessed(). We now have all the pieces to track read-ahead cache and we can visualize it as follows:

For a given PID, track when we have entered __do_page_cache_readahead(). If we have entered it, and the kernel allocated a page using __page_cache_alloc(), remember the page address, increment the read-ahead page count (rapage here) and the note the timestamp when we allocated it (TS1). Now, each time that exact page is accessed, decrement rapage, take timestamp (TS2) and find out how long that page was in the cache (TS2-TS1). This way at any given snapshot of time, we will know:
- How many pages are in read-ahead cache (
rapagecount) - How long they were there (map of TS2-TS1 and each page)
Writing the eBPF program
In case you didn’t notice this, the logic is looking much like a state machine. So, wouldn’t it be nice if we had some way to record state in some data structures? eBPF provides map based data structures to work with such logic. We will use the same in our program as well.
Readahead the old way (BCC Python/C)
Lets first look at the old way of using Python/C. You can still find the BCC tools in the BCC repos and here is the readahead program that I had ported to this format. BCC allows us to write our BPF tool in a hybrid C/Python format. The BPF part of the program is in C which gets compiled down to the BPF bytecode. This is then hooked to the necessary kernel function using bpf() syscall made via the Python part of the tool. We also used this Python code to make our lives easy since it provides some wrappers to read and update data shared from the from it – which will store our data such as timestamps and page counts. BCC provides us with some high level data structures like BPF_HASH, BPF_ARRAY and BPF_HISTOGRAM which are all built over generic KV store data structures called BPF Maps that we talked about before. They are used to maintain state/context and share data with userspace as well. The concept of maps and their creative uses is vast. I’ll link a small tool by Cilium folks called bpf-map that has helped me from time to time to understand what is in the maps and how they work. In our case, we use them as shown in the diagram below:

In the BPF C code embedded in the python program, you can also see the 4 functions (entry_* and exit_*) that we want to execute at certain hooks in the kernel. We used kprobes and kretprobes mechanism to attach these to the kernel functions. This is done via the python helper function here:
b.attach_kprobe(event="__do_page_cache_readahead", fn_name="entry__do_page_cache_readahead")
b.attach_kretprobe(event="__do_page_cache_readahead", fn_name="exit__do_page_cache_readahead")
b.attach_kretprobe(event="__page_cache_alloc", fn_name="exit__page_cache_alloc")
b.attach_kprobe(event="mark_page_accessed", fn_name="entry_mark_page_accessed")
As the readhaead python script is run and the BPF programs attached to the kernel methods, everytime the method is accessed the tiny BPF function executes and updates the BPF maps with the values from kernel! So all that remains is to periodically query the maps and start plotting some histograms. That is done easily since the data from maps is accessed via directly accessing the maps as keys from the “bpf object”:
b["dist"].print_log2_hist("age (ms)")
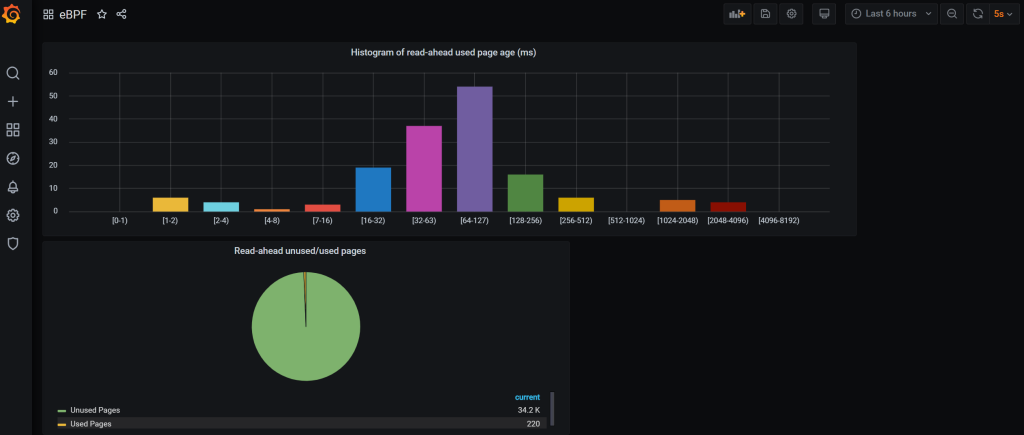
We could also extend it easily to push data to InfluxDB and then plot it in Grafana with just a few more lines as we can see here. This gives us some cool live graphs!

Seems cool, so why deprecate?
While this looks fine and dandy for one-off tooling, in order to build a more scalable and portable observation/debugging solution we need multitudes of such tools running in machines that have different kernel versions and resources at their disposal. Two problems arise:
- Resources: BCC tools required LLVM toolchain, and Python to be on the machines where the tools are run since BPF bytecode had to be compiled on-the-fly from within the Python program and that too for the specific kernel version. This could easily be ~145 MB+ install while the compiled BPF programs that actually need to be inserted are essentially just a few kilobytes. The hosts system supports bpf syscalls so just managing and pushing BPF code to kernel should not require compiler tool-chains and python programming. Or should they? This brings us closer to the 2nd constraint.
- Portability: What if we could pre-compile the BPF programs? This way we avoid the resource constraint! This is easier said than done. Infact, we tried to do this 3 years back when we built a tracing framework called TraceLeft where we went all crazy and tried to template the C part of the BPF programs, create a battery of pre-compiled programs and used gobpf library to push it to kernel! (yep, such horrors!) The issue is that some BPF programs gather very specific information from the points in which they hook in the kernel (tracepoints/k(ret)probes). Kernel data structures from which we need to gather data may change based on what kernel is being used on the system in which the BPF code is being run. On a massive distributed cluster with thousands of node each working on different versions and resources, how can we get consistent values from our eBPF sensors?
This is solved by two new key technologies in the BPF that have been recently introduced – BTF and CO-RE. I think both of them demand a separate deep dive, but in summary they allow type information to be stored in compiled BPF binary and kernel binary (much like DWARF symbols which help us in debugging and understanding programs at runtime) and then using this with Clang to write relocation values in the compiled program. At runtime, based on what kernel it is being run on, the libbpf based BPF program loader matches the kernel’s ABI info from running kernel’s BTF to the BPF program’s BTF data and does a rewrite of certain parts of the programs to make it run on the host kernel. Even though it is quite different, we can somewhat draw parallels with the technique of how relocation works in ELF binaries where at runtime the relocation symbols are replaced with actual library addresses. Won’t hurt to do some side reading on ELF Relocations if you want.
Readahead the new way (libbpf/CO-RE)
So, now lets try to do it the new way. Luckily for us, Wenbo Zhang ported it to libbpf/CO-RE C. It’s in two parts – the BPF code that will be compiled to BPF bytecode and the BPF program loader that uses libbpf and helps in tailoring the program to make it portable and loading it in kernel. Looking at the BPF code, the first familiar thing we see is the two BPF maps used for tracking when we are in the read-ahead mechanism and then a map of each page along with the timestamp. Here is the first map where the key is the PID and value is just a binary flag used to track if we are in readahead.
struct {
__uint(type, BPF_MAP_TYPE_HASH);
__uint(max_entries, MAX_ENTRIES);
__type(key, u32);
__type(value, u64);
__uint(map_flags, BPF_F_NO_PREALLOC);
} in_readahead SEC(".maps");
As we can see, we have a SEC macro which defines that this will go in the .map section of the compiled BPF ELF binary. This is followed by the actual BPF functions that go in their own sections. They are very similar in their behaviour to the previous BPF code we have seen and are supposed to be attached to the same 4 functions in the kernel that we need to build the readahead tool. Libbpf can then parse the BPF object and load individual parts from the binary to proper places in the kernel. This is quite standard and has not changed much since the olden days. Some old (and probably defunct) examples are here: https://github.com/Netronome/bpf-samples/tree/master/xdpdump You can see similar structure of a *_user.c program that uses libbpf to parse and load the BPF binary and its counterpart _kern.c program that is actually the BPF code that will be compiled and loaded. But what about those custom kernel headers that are being included? This is exactly where the new libbpf/CO-RE comes into the picture!
In the new approach, there is a single vmlinux.h which is all that’s needed. It needs to be generated from a kernel compiled with CONFIG_DEBUG_INFO_BTF=y. The next interesting part is the BPF skeleton header – readahead.skel.h. You can see that the readahead.c program has included this. This is actually generated using the compiled BPF ELF (readahead.bpf.c) containing the BTF information. Once generated, it provides the following functions that we will use to adjust the BPF binary and load it in the kernel:
readahead_bpf__open_and_load(): First the readahead BPF ELF binary is parsed and all its sections identified. Then all its components are created (the 2 maps we need, functions etc.). The 4 bpf functions and all other parts are now available in the kernel memory but no function has yet been executed.readahead_bpf__attach(): Here, the each in-memory function from the loaded readahead BPF program is attached the the respective kprobes automatically. The program is now essentially live and will start collecting data in the maps as soon as we hit a__do_page_cache_readhaead()method now. Periodically, we can now access the maps from userspace andreadahead_bpf__destroy(): Once the program is finished. we can detach it and free the BPF objects kernel memory.
So it seems, we are almost at the end. The best way to build tools in the new libbpf/CO-RE style is to actually check how current tools are being ported. Check out libbpf-tools directory for more examples.
Suggested Reading
- Linux Readahead: less tricks for more by Wu et. al., Proc, Ottawa Linux Symposium, 2007
- Efficient Memory Mapped File I/O for In-Memory File Systems, Choi et. al. Proc. USENIX HotStorage, 2017
- BPF Portability and CO-RE by Andrii Nakryiko
- BCC to libbpf conversion guide by Andrii Nakryiko
- BPF binaries: BTF, CO-RE, and the future of BPF perf tools by Brendan Gregg
- BPF Type Format Docs
Tools of the Future
Imagine creating an army of portable BPF programs that you can ship across a fleet of heterogeneous hosts with no restrictions on kernels or features. And then use them to create your custom performance/security solutions – across userpace, kernelspace and the language runtimes in-between. Tools that require no explicit static instrumentation or crazy integrations, kernel modules – tools are versatile enough that they can be run always on, or used for post-mortem analysis. Tools that create flame-charts from API spans between services (on pods like abstractions) all the way down to the exact irregular network IRQ routine delaying your reads in the kernel on exactly of your 1000s of clusters. Couple that with visualizations that allow you to zoom in and out, temporally and qualitatively, without switching tools or context. I think with eBPF, we can finally have a unified language for observability and the ability to “craft what you want to see” and throw useless decade old vendor dashboards away.
Happy tracing!