Kernel, Linux, Perf, Qt

Deconstructing Perf’s Data File

It is no mystery that Perf is like a giant organism written in C with an infinitely complex design. Of course, there is no such thing. Complexity is just a state of mind they would say and yes, it starts fading away as soon as you get enlightened. So, one fine day, I woke up and decided to understand how the perf.data file works because I wanted to extract the Intel PT binary data from it. I approached Francis and we started off on an amazing adventure (which is still underway). If you are of the impatient kind, here is the code.

A Gentle Intro to Perf

I would not delve deep into Perf right now. However, the basics are simple to grasp. It is like a Swiss army knife which contains tools to understand your system from either a very coarse to a quite fine granularity level. It can go all the way from profiling, static/dynamic tracing to custom analyses build up on hardware performance counters. With custom scripts, you can generate call-stacks, Flame Graphs and what not! Many tracing tools such as LTTng also support adding perf contexts to their own traces. My personal experience with Perf has usually been just to profile small piece of code. Sometimes I use its annotate feature to look at the disassembly to see instruction profiling right from my terminal. Occasionally, I use it to get immediate stats on system events such as syscalls etc. Its fantastic support with the Linux kernel owing to the fact that it is tightly bound to each release, means that you can always have reliable information. Brendan Gregg has written so much about it as part of his awesome Linux performance tools posts. He has some some actual useful stuff you can do with Perf. My posts here just talks about some of its internals. So, if Perf was a dinosaur, I am just talking about its toe in this post.

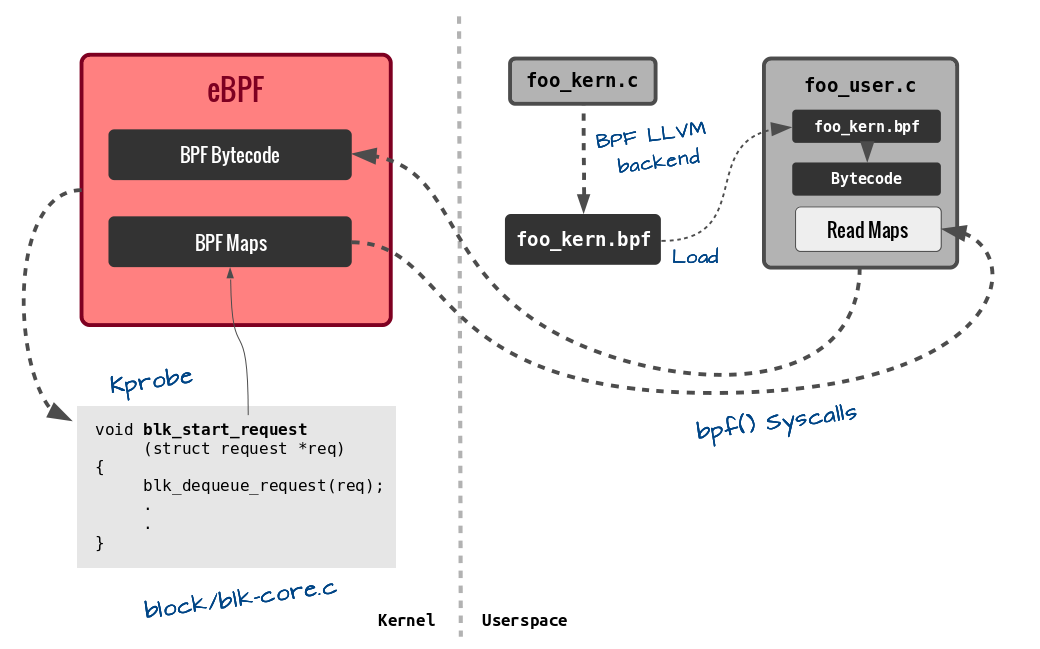
Perf contains a kernel part and a userspace part. The userspace part of Perf is located in the kernel directory tools/perf. The perf command that we use is compiled here. It reads kernel data from the Perf buffer based on the events you select for recording. For a list of all events you can use, do perf list or sudo perf list. The data from the Perf’s buffer is then written to the perf.data file. For hardware traces such as in Intel PT, the extra data is written in auxiliary buffers and saved to the data file. So to get your own custom stuff out from Perf, just read its data file. There are multiple ways like using scripts too, but reading a binary directly allows for a better learning experience. But the perf.data is like a magical output file that contains a plethora of information based on what events you selected, how the perf record command was configured. With hardware trace enabled, it can generate a 200MB+ file in 3-4 seconds (yes, seriously!). We need to first know how it is organized and how the binary is written.

Dissection Begins

Rather than going deep and trying to understand scripted ways to decipher this, we went all in and opened the file with a hex editor. The goal here was to learn how the Intel PT data can be extracted from the AUX buffers that Perf used and wrote in the perf.data file. By no means is this the only correct way to do this. There are more elegant solutions I think, esp. if you see some kernel documentation and the uapi perf_event.h file or see these scripts for custom analysis. Even then, this can surely be a good example to tinker around more with Perf. Here is the workflow:

  1. Open the file as hex. I use either Vim with :%!xxd command or Bless. This will come in handly later.
  2. Use perf report -D to keep track of how Perf is decoding and visualizing events in the data file in hex format.
  3. Open the above command with GDB along with the whole Perf source code. It is in the tools/perf directory in kernel source code.

If you setup your IDE to debug, you would also have imported the Perf source code. Now, we just start moving incrementally – looking at the bytes in the hex editor and correlating them with the magic perf report is doing in the debugger. You’ll see lots of bytes like these :

Screenshot from 2016-06-16 19-01-42

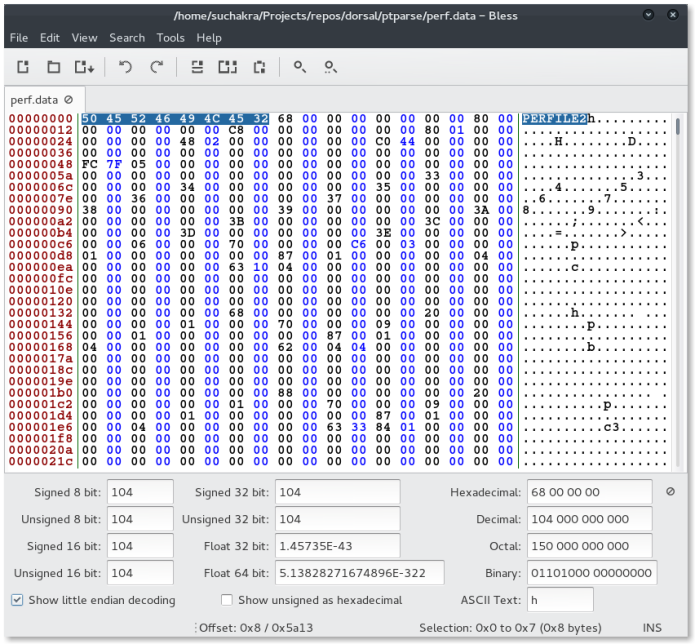
A cursory looks tells us that the file starts with a magic – PERFFILE2. Searching it in the source code eventually leads to the structure that defines the file header:

 struct perf_file_header {
   u64 magic;
   u64 size;
   u64 attr_size;
   struct perf_file_section attrs;
   struct perf_file_section data;
   /* event_types is ignored */
   struct perf_file_section event_types;
   DECLARE_BITMAP(adds_features, HEADER_FEAT_BITS);
};

So we start by mmaping the whole file to buf and just typecasting it to this. The header->data element is an interesting thing. It contains an offset and size as part of perf_file_section struct. We observe, that the offset is near the start of some strings – probably some event information? Hmm.. so lets try to typecast this offset position in the mmap buffer (pos + buf) to perf_event_header struct :

struct perf_event_header {
   __u32 type;
   __u16 misc;
   __u16 size;
};

For starters, lets further print this h->type and see what the first event is. With our perf.data file, the perf report -D command as a reference tells us that it may be the event type 70 (0x46) with 136 (0x88) bytes of data in it. Well, the hex says its the same thing at (buf + pos) offset. This in interesting! Probably we just found our event. Lets just iterate over the whole buffer while adding the h->size. We will print the event types as well.

while (pos < file.size()) {
    struct perf_event_header *h = (struct perf_event_header *) (buf + pos);
    qDebug() << "Event Type" <type;
    qDebug() << "Event Size" <size;
    pos += h->size;
}

Nice! We have so many events. Who knew? Perhaps the data file is not a mystery anymore. What are these event types though? The perf_event.h file has a big enum with event types and some very useful documentation. Some more mucking around leads us to the following enum :

enum perf_user_event_type { /* above any possible kernel type */
    PERF_RECORD_USER_TYPE_START = 64,
    PERF_RECORD_HEADER_ATTR = 64, 
    PERF_RECORD_HEADER_EVENT_TYPE = 65, /* depreceated */
    PERF_RECORD_HEADER_TRACING_DATA = 66,
    PERF_RECORD_HEADER_BUILD_ID = 67,
    PERF_RECORD_FINISHED_ROUND = 68,
    PERF_RECORD_ID_INDEX = 69,
    PERF_RECORD_AUXTRACE_INFO = 70,
    PERF_RECORD_AUXTRACE = 71,
    PERF_RECORD_AUXTRACE_ERROR = 72,
    PERF_RECORD_HEADER_MAX
};

So event 70 was PERF_RECORD_AUXTRACE_INFO. Well, the Intel PT folks indicate in the documentation that they store the hardware trace data in an AUX buffer. And perf report -D also shows event 71 with some decoded PT data. Perhaps, that is what we want. A little more fun with GDB on perf tells us that while iterating perf itself uses the union perf_event from event.h which contains an auxtrace_event struct as well.

struct auxtrace_event {
    struct perf_event_header header;
    u64 size;
    u64 offset;
    u64 reference;
    u32 idx;
    u32 tid;
    u32 cpu;
    u32 reserved__; /* For alignment */
};

So, this is how they lay out the events in the file. Interesting. Well, it seems we can just look for event type 71 and then typecast it to this struct. Then extract the size amount of bytes from this and move on. Intel PT documentation further says that the aux buffer was per-CPU so we may need to extract separate files for each CPU based on the cpu field in the struct. We do just that and get our extracted bytes as raw PT packets which the CPUs generated when the intel_pt event was used with Perf.

A Working Example

The above exercise was surprisingly easy once we figured out stuff so we just did a small prototype for our lab’s research purposes.  There are lot of things we learnt. For example, the actual bytes for the header (containing event stats etc. – usually the thing that Perf prints on top if you do perf report --header) are actually written at the end of the Perf’s data file. How endianness of file is determined by magic. Just before the header in the end, there are some bytes which I still have not figured out (near event 68) how they can be handled. Perhaps it is too easy, and I just don’t know the big picture yet. We just assume there are no more events if the event size is 0 😉 Works for now. A more convenient way that this charade is to use scripts such as this for doing custom analyses. But I guess it is less fun that going all l33t on the data file.

I’ll try to get some more events out along with the Intel PT data and see what all stuff is hidden inside. Also, Perf is quite tightly bound to the kernel for various reasons. Custom userspace APIs may not always be the safest solution. There is no guarantee that analyzing binary from newer versions of Perf would always work with the approach of our experimental tool. I’ll keep you folks posted as I discover more about Perf internals.

Standard
Linux

Custom Kernel on 96boards Hikey LeMaker

I started exploring CoreSight on the newer Cortex A-53 based platforms and the one which caught my eye was a Hisilicon Kirin 620 octa-core CPU based Hikey LeMaker. It seems really powerful for the size it comes in. However, the trials with Coresight did not end well for me as I soon realized that there is some issue in hardware that is preventing Coresight access on all CPUs with upstream kernel drivers. I further looked at the device tree files in their kernel tree and it seems the descriptions for CoreSight components is still not there. Probably it will be fixed somehow with more kernel patches hopefully. I did not experiment with it further. Apart from that, the board seems a really nice thing to play around with. There is Android as well as Debain support that works out of the box. I am just documenting steps I used to get a custom kernel for the board so that I don’t forget them 😉 Probably someone else may also find them useful. For a complete guide go here. Lets start with getting the necessary files and the latest filesystem. I am using the 17th March snapshot from here. It is based on the hikey-mainline-rebase branch of their custom Linux kernel repo. Hopefully in the near future none of this will be required and things get into mainline. We also need the flashing tools and bootloader from here.

Updating with pre-built Images

The board ships with a v3.10 kernel. We need to first update it with the prebuilt binaries and then add our own custom built kernel to a custom location in rootfs. First get fastboot on your host with

$ sudo dnf install fastboot

Then copy the following lines in /etc/udev/rules.d/51-android.rules on the host so we can set proper read/write permissoins and access it withour root.

SUBSYSTEM=="usb", ATTR{idVendor}=="18d1", ATTR{idProduct}=="d00d", MODE="0660", GROUP="dialout"
SUBSYSTEM=="usb", ATTR{idVendor}=="12d1", ATTR{idProduct}=="1057", MODE="0660", GROUP="dialout"
SUBSYSTEM=="usb", ATTR{idVendor}=="12d1", ATTR{idProduct}=="1050", MODE="0660", GROUP="dialout"

Now close Jumper 1 and Jumper 2 in CONFIG section (J601) on the board. It is near the Extended IO. Power on the board. If you have a serial connection to your host, nothing should come up. Now send the boot downloader to the board. A green LED lights up. Also, after that check if the device is now recognized by fastboot.

$ sudo python hisi-idt.py -d /dev/ttyUSB0 --img1=l-loader.bin
$ sudo fastboot devices

The board should now be listed by fastboot as a device. We now start writing all binaries to the EMMC – partition table, kernel image, rootfs etc to get the system alive again. The 8G table is for the board with 8G NAND.

$ sudo fastboot flash ptable ptable-linux-8g.img
$ sudo fastboot flash fastboot fip.bin
$ sudo fastboot flash nvme nvme.img
$ sudo fastboot flash boot boot-fat.uefi.img
$ sudo fastboot flash system hikey-jessie_developer_20160317-33.emmc.img

We are done. Open Jumper 2 and restart. You should now see the snapshot kernel being booted up.

Build Custom Kernel

This is a quick way to build and test kernels based on the source from here. More and detailed information on building software from source is here. You will also need a cross toolchain to build the kernel. Get the Linaro one and set it up.

$ export LOCALVERSION="-suchakra-hikey"
$ make distclean
$ make ARCH=arm64 CROSS_COMPILE=aarch64-linux-gnu- defconfig

You can customize what you want in the kernel now and then build the Image, modules and the device tree blob,

$ make ARCH=arm64 CROSS_COMPILE=aarch64-linux-gnu- menuconfig 
$ make ARCH=arm64 CROSS_COMPILE=aarch64-linux-gnu- -j8 Image modules hisilicon/hi6220-hikey.dtb

Install the modules in a local directory for now

$ make ARCH=arm64 CROSS_COMPILE=aarch64-linux-gnu- INSTALL_MOD_PATH=./modules-4.4-suchakra modules_install

Transfer Kernel to Board

Next, copy /arch/arm64/boot/Image and /arch/arm64/boot/dts/hisilicon/hi6220-hikey.dtb  from the host to the board in /boot/suchakra directory. You can just scp these from the host. Add another menu entry in  /boot/efi/…/grub.cfg with the new kernel and dtb file. You can keep the initrd same. Copy the /lib/modules inside modules-4.4-suchakra from host to the target.

That is all. Time to reboot! I sometimes need to build custom kernel often so I have setup a script to build and scp the image from host to the target.

What about CoreSight?

As I said before, this may not be the best platform to experiment CoreSight however it maybe possible to access trace features using the Coresight Access Library from ARM DS-5. I also tried the Snapdragon based Dragonboard 410c and I was able to build and run the 4.4 kernel with CoreSight support quite quickly on that one as well. Linaro developers hint at CoreSight support for A-53 (v8) reaching mainline kernel in v4.7. The v4.4 one that I have right now is from the landing-team git of Linaro. I can confirm that on Dragonboard 410c, it is possible to get traces using ETF as sink and ETM as source by using the default kernel drivers and following  the default kernel documentation on the same. The generated trace binary can be read using ptm2human which supports ETMv4 now. However, I am still trying to get my head around what the decoded traces actually mean. More coresight stuff will follow as I discover its power. Apart from that, it was fun learning how DTBs work 🙂

Standard
Linux

BPF Internals – II

Continuing from where I left before, in this post we would see some of the major changes in BPF that have happened recently – how it is evolving to be a very stable and accepted in-kernel VM and can probably be the next big thing – in not just filtering but going beyond. From what I observe, the most attractive feature of BPF is its ability to give access to the developers so that they can execute dynamically compiled code within the kernel – in a limited context, but still securely. This itself is a valuable asset.

As we have seen already, the use of BPF is not just limited to filtering out network packets but for seccomp, tracing etc. The eventual step for BPF in such a scenario was to evolve and come out of it’s use in the network filtering world. To improve the architecture and bytecode, lots of additions have been proposed. I started a bit late when I saw Alexei’s patches for kernel version 3.17-rcX. Perhaps, this was the relevant mail by Alexei that got me interested in the upcoming changes. So, here is a summary of what all major changes have occured. We will be seeing each of them in sufficient detail.

Architecture

The classic BPF we discussed in the last post had two 32 bit registers – A and X. All arithmetic operations were supported and performed using these two registers. The newer BPF called extended-BPF or eBPF has ten 64 bit registers and supports arbitary load/stores. It also contains new instructions like BPF_CALL which can be used to call some new kernel-side helper functions. We will look into this in detail a bit later as well. The new eBPF follows calling conventions which are more like modern machines (x86_64). Here is the mapping of the new eBPF registers to x86 registers :

R0 – rax      return value from function
R1 – rdi      1st argument
R2 – rsi      2nd argument
R3 – rdx      3rd argument
R4 – rcx      4th argument
R5 – r8       5th argument
R6 – rbx      callee saved
R7 - r13      callee saved
R8 - r14      callee saved
R9 - r15      callee saved
R10 – rbp     frame pointer

The closeness to the machine ABI also ensures that unnecessary register spilling/copying can be avoided. The R0 register stores the return from the eBPF program and the eBPF program contexts can be loaded through register R1. Earlier, there used to be just two jump targets i.e. either jump to TRUE or FALSE targets. Now, there can be arbitary jump targets – true or fall through. Another aspect of the eBPF instruction set is the ease of use with the in-kernel JIT compiler. eBPF Registers and most instructions are now mapped one-to-one. This makes emitting these eBPF instructions from any external compiler (in userspace) not such a daunting task. Of course, prior to any execution, the generated bytecode is passed through a verifier in the kernel to check its sanity. The verifier in itself is a very interesting and important piece of code and probably story for another day.

Building BPF Programs

From a users perspective, the new eBPF bytecode can now be another headache to generate. But fear not, an LLVM based backend now supports instructions being generated for BPF pseudo-machine type directly. It is being ‘graduated’ from just being an experimental backend and can hit the shelf anytime soon. In the meantime, you can always use this script to setup the BPF supported LLVM yourslef. But, then what next? So, a BPF program (not necessarily just a filter anymore) can be done in two parts – A kernel part (the BPF bytecode which will get loaded in the kernel) and the userspace part (which may, if needed gather data from the kernel part) Currently you can specify a eBPF program in a restricted C like language. For example, here is a program in the restricted C which returns true if the first argument of the input program context is 42.  Nothing fancy :

#include <include/bpf.h>

int answer(struct bpf_context *ctx)
{
    int life;
    life = ctx->arg1;

    if (life == 42){
        return 1;
    }
    return 0;
}

This C like syntax generates a BPF binary which can then be loaded in the kernel. Here is what it looks like in BPF ‘assembly’ representation as generated by the LLVM backed (supplied with 3.4) :

        .text
        .globl  answer
        .align  8
answer:                                 # @answer
# BB#0:
        ldw     r1, 0(r1)
        mov     r0, 1
        mov     r2, 42
        jeq     r1, r2 goto .LBB0_2
# BB#1:
        mov     r0, 0
.LBB0_2:
        andi    r0, 1
        ret

If you are adventerous enough, you can also probably write complete and valid BPF programs in assembly in a single go – right from your userspace program. I do not know if this is of any use these days. I have done this sometime back for a moderately elaborate trace filtering program though. It is also not effective as well, becasue I think at this point in human history, LLVM can generate assembly better and more efficiently than a human.

What we discussed just now is probably not a relevant program anymore. An example by Alexei here is what is more relevant these days. With the integration of Kprobe with BPF, a BPF program can be run at any valid dynamically instrumentable function in the kernel. So now, we can probably just use pt_regs as the context and get individual register values at each time the probe is hit. As of now, some helper functions are available in BPF as well, which can get the current timestamp. You can have a very cheap tracing tool right there 🙂

BPF Maps

I think one of the most interesting features in this new eBPF is the BPF maps. It looks like an abstract data type – initially a hash-table, but from kernel 3.19 onwards, support for array-maps seems to have been added as well. These bpf_maps can be used to store data generated from a eBPF program being executed. You can see the implementation details in arraymap.c or hashtab.c Lets pause for a while and see some more magic added in eBPF – esp. the BPF syscall which forms the primary interface for the user to interact and use eBPF. The reason we want to know more about this syscall is to know how to work with these cool BPF maps.

BPF Syscall

Another nice thing about eBPF is a new syscall being added to make life easier while dealing with BPF programs. In an article last year on LWN Jonathan Corbet discussed the use of BPF syscall. For example, to load a BPF program you could call

syscall(__NR_bpf, BPF_PROG_LOAD, &attr, sizeof(attr));

with of course, the corresponding bpf_attr structure being filled before :

union bpf_attr attr = {
    .prog_type = prog_type, /* kprobe filter? socket filter? */  
    .insns = ptr_to_u64((void *) insns), /* complete bpf instructions */
    .insn_cnt = prog_len / sizeof(struct bpf_insn), /* how many? */
    .license = ptr_to_u64((void *) license), /* GPL maybe */
    .log_buf = ptr_to_u64(bpf_log_buf), /* log buffer */
    .log_size = LOG_BUF_SIZE,
    .log_level = 1,
};

Yes, this may seem cumbersome to some, so for now, there are some wrapper functions in bpf_load.c and libbpf.c released to help folks out where you may need not give too many details about your compiled bpf program. Much of what happens in the BPF syscall is determined by the arguments supported here. To elaborate more, let’s see how to load the BPF program we did before. Assuming that we have the sample program in its BPF bytecode form generated and now we want to load it up, we take the help of the wrapper function load_bpf_file() which parses the BPF ELF file and extracts the BPF bytecode from the relevant section. It also iterates over all ELF sections to get licence info, map info etc. Eventually, as per the type of BPF program – Kprobre/kretprobe or socket program, and the info and bytecode just gathered from the ELF parsing, the bpf_attr attribute structure is filled and actual syscall is made.

Creating and accessing BPF maps

Coming back to the maps, apart from this simple syscall to load the BPF program, there are many more actions that can be taken based on just the arguments. Have a look at bpf/syscall.c From the userspace side the new BPF syscall comes to the rescue and allows most of these operations on bpf_maps to be performed! From the kernel side however, with some special helper function and the use of BPF_CALL instruction, the values in these maps can be updated/deleted/accessed etc. These helpers inturn call the actual function according to the type of map – hash-map or an array. For example, here is a BPF program that just creates an array-map and does nothing else,

#include <uapi/linux/bpf.h>
#include "bpf_helpers.h"
#include <linux/version.h>

struct bpf_map_def SEC("maps") sample_map = { 
    .type = BPF_MAP_TYPE_ARRAY,
    .key_size = sizeof(u32),
    .value_size = sizeof(unsigned int),
    .max_entries = 1000,
};

char _license[] SEC("license") = "GPL";
u32 _version SEC("version") = LINUX_VERSION_CODE;

When loaded in the kernel, the array-map is created. Form the userspace we can then probably initialize the map with some values with a function that look likes this,

static void init_array() 
{
    int key;
    for (key = 0; key < 1000; key++) {
        bpf_update_elem(map_fd[0], &key, &value1, BPF_ANY);
    }
}

where bpf_update_elem() wrapper is in-turn calling the BPF syscall with proper arguments and attributes as,

syscall(__NR_bpf, BPF_MAP_UPDATE_ELEM, &attr, sizeof(attr));

This inturn calls map_update_elem() which securely copies the key and value using copy_from_user() and then calls the specialized function for updating the value for array-map at the specified index. Similar things happen for reading/deleting/creating has or array maps from userspace.

So probably, things will start falling into pieces now from the earlier post by Brendan Gregg where he was updating a map from the BPF program (using the BPF CALL instruction which calls the internal kernel helpers) and then concurrently accessing it from userspace to generate a beautiful histogram (through the syscall I just mentioned above). BPF Maps are indeed a very powerful addition to the system. You can also checkout more detailed and complete examples now that you know what is going on. To summarize, this is how an example BPF program written in restricted C for kernel part and normal C for userspace part would run these days:

eBPF-session

In the next BPF post, I will discuss the eBPF  verifier in detail. This is the most crucial part of BPF and deserves detailed attention I think. There is also something cool happening these days on the Plumgrid side I think – the BPF Compiler Collection. There was a very interesting demo using such tools and the power of eBPF at the recent Red Hat Summit. I got BCC working and tried out some examples with probes – where I could easily compile and load BPF programs from my Python scripts! How cool is that 🙂 Also, I have been digging through the LTTng’s interpreter lately so probably another post detailing how the BPF and LTTng’s interpreters work would be nice to know. That’s all for now. Run BPF.

Standard
Linux

FUDCon Pune 2015

venue_mit

This year’s FUDCon for the APAC region was held once more in the same city of Pune. Attending FUDCon reminded me of 2011 – the last time this event was in Pune. I had submitted some talks and sessions as I still feel more of an APAC guy even though I have changed zones for sometime now. Hoping that there would be enough folks interested to know what I have been working on for the last couple of years, I submitted a talk “Kernel and Userspace tracing with LTTng and friends”. You can see the slides here. Of course, systems performance consumes most of my waking hours and I thought that it would benefit Fedora as well. I was happy when I saw that the talk was selected and there was an opportunity for me to share my experiences with others in Pune. Along with this talk I was also going to take a Kenrel module workshop and AskFedora UX/UI hackfest that me and Sarup decided to run. I knew that my FUDCon would be packed 🙂

I arrived on 24th night, all jetlagged and tired from a long journey. I met Izhar and Somvannda at Mumbai and we all set out for Pune. To our surprise, Siddhesh and Kushal were waiting for our arrival at 3am in the hotel. Thanks guys for your seamless efforts in co-ordinating travel for speakers! (and of course a whole lot of other things you did). We quickly hit the sack. Most of the next day was spent in doing some chores for FUDCon organization – packing the goodie bags with Ani and Danishka at Siddhesh’s house. We went to the Red Hat Pune office subsequently where I met Jared, Shreyank, Prasad, Harish, Sinny et al.

rhposter2

Also, as you can see, Izhar was not afraid of some fizzy-drinks fireworks in the RH office as well. Chillax. It was just a photo-op 🙂

Day 1

I had a very small selection of talks to attend. The day started with Harish’s keynote and then a Education panel discussion. I soon diverted to some other talks. I started with the kdump and kernel crash analysis workshop by Buland Singh and Gopal Tiwari. Their slides and explaination was good but unfortunateley the demo failed. I moved on to Sinny’s presentation on ABI compatability. This one was delivered quite well IMO. I wanted to attend Vaidik’s Vagrant talk but settled on for Samikshan’s talk on his “spartakus” tool to detect kernel ABI breakages. It was something done based on the “sparse” tool. I went to the FUDCon APAC BoF next to see how palnning was being done. I don’t remember exactly but probably the day ended with a visit to a local microbrewery.

Day 2

I met Sankarshan after a long time. He was manning the Fedora booth like a soldier in the vanguard. I also saw the FUDCon T-shirts that I designed today. They looked quite well done which of course made me happy. I picked up some FUDCoins (aka Fedora pin-badges). Legend (me) says that you can not buy worldly stuff but just pure emotions with such coins. I soon moved to the opening keynote by Jiri was nice – mostly becasue he told us that the mp3 paptent was expiring soon and possibly Fedora would support mp3 soon out of the box. Next was my talk on tracing. Dunno how that went, but some folks met me in the end demanding the copy of  Brendan’s performance tools cheat-sheet. Felt nice that people there cared about this 🙂 HasGeek folks tell me that the videos will be available soon. By that time, here are the slides. I continued to Pravin’s talk on Internationalization – quite nice, and then to an old friend Kiran’s talk on Wifi internals. This one was sufficiently detailed and quite informative. I then went on to deliver a workshop on Kernel module programming where I basically started with a simple hello world module and ended with a netfilter hooks based small packet filter. Some first year students from Amrita univeristy looked very enthusiastic. They even met me and asked me how to begin kernel programming. I was impressed how much pumped up they were even in the first year about kernel proramming!

Look who's trying to bore people to death

Look who’s trying to bore people to death

This day ended with the customary FUDPub. We also spent the night talking late at night about life universe and everything with Sinny and Charul – while seeing a buzzed Sarup struggling to make coffee and tea for us as he intermittently poured in his inputs 🙂 This was somewhat like the famous pink slippers incident of FUDCon 2011

Best. FUDPub. Ever.

I don’t think I can explain how awesome a FUDPub can be when you have awesome food, drinks and a whole bowling alley booked for the volunteers and speakers. It was truly awesome. We all agreed that this has set a threshold for all the future FUDPubs now!

blue-o

Day 3

The last day was more of hackfests and some workshops such as Docker workshop by Aditya, Lalatendu and Shivprasad (which I did not attend, but have been told that it was really good). I however attended a really good workshop on Inkscape by Sirko and then a small part of the Blender workshop by Ryan Lerch. It was nice seeing some folks pouring in with their Blender model renders in Harish’s keysigning party and looking content with they dancing cube 🙂 I am sure Ryan did an awesome job in showing them the power of Blender! I was tired by this time and the attendance was thinning, but me and Sarup still managed the AskFedora hackfest. There were a few folks but still we managed to get some good feedback on the UI done till now by our GSoC student Anuradha from particiapants Charul and Sinny. I have to prepare a feedback soon for her so that she can make changes. We ended the day with yet another long night of discussions with Siddhesh, Kushal, Charul, Sarup and Sinny.

In the end, I would say – it was an awesome event. The quality of talks was really good. I hope it benefited students and the industry folks that attended these. Also, Sarup is an all round awesome guy and a nice roommate. I will update this if I remember something more and if I manage to get some more photos from the event.

EDIT: Added photos. Venue and my talk photo shamelessly taken from Sinny’s photostream on Flickr.

Standard
Embedded, Kernel, Linux

BPF Internals – I

Recent post by Brendan Gregg inspired me to write my own blog post about my findings of how Berkeley Packet Filter (BPF) evolved, it’s interesting history and the immense powers it holds – the way Brendan calls it ‘brutal’. I came across this while studying interpreters and small process virtual machines like the proposed KTap’s VM. I was looking at some known papers on register vs stack basd VMs, their performances and various code dispatch mechanisms used in these small VMs. The review of state-of-the-art soon moved to native code compilation and a discussion on LWN caught my eye. The benefits of JIT were too good to be overlooked, and BPF’s application in things like filtering, tracing and seccomp (used in Chrome as well) made me interested. I knew that the kernel devs were on to something here. This is when I started digging through the BPF background.

Background

Network packet analysis requires an interesting bunch of tech. Right from the time a packet reaches the embedded controller on the network hardware in your PC (hardware/data link layer) to the point they do someting useful in your system, such as display something in your browser (application layer). For connected systems evolving these days, the amount of data transfer is huge, and the support infrastructure for the network analysis needed a way to filter out things pretty fast. The initial concept of packet filtering developed keeping in mind such needs and there were many stategies discussed with every filter such as CMU/Stanford packet Filter (CSPF), Sun’s NIT filter and so on. For example, some earlier filtering approaches used a tree based model (in CSPF) to represenf filters and filter them out using predicate-tree walking. This earlier approach was also inherited in the Linux kernel’s old filter in the net subsystem.

Consider an engineer’s need to have a probably simple and unrealistic filter on the network packets with the predicates P1, P2, P3 and P4 :

equation

Filtering approach like the one of CSPF would have represented this filter in a expression tree structure as follows:

tree

It is then trivial to walk the tree evaluating each expression and performing operations on each of them. But this would mean there can be extra costs assiciated with evaluating the predicates which may not necessarily have to be evaluated. For example, what if the packet is neither an ARP packet nor an IP packet? Having the knowledge that P1 and P2 predicates are untrue, we may need not have to evaluate other 2 predicates and perform 2 other boolean operation on them to determine the outcome.

In 1992-93, McCanne et al. proposed a BSD Packet Filter with a new CFG-bytecode based filter design. This was an in-kernel approach where a tiny interpreter would evaluate expressions represented as BPF bytecodes. Instead of simple expression trees, they proposed a CFG based filter design. One of the control flow graph representation of the same filter above can be:

cfg

The evaluation can start from P1 and the right edge is for FALSE and left is for TRUE with each predicate being evaluated in this fashion until the evaluation reaches the final result of TRUE or FALSE. The inherent property of ‘remembering’ in the CFG, i.e, if P1 and P2 are false, the path reaches a final FALSE is remembered and P3 and P4 need not be evaluated. This was then easy to represent in bytecode form where a minimal BPF VM can be designed to evaluate these predicates with jumps to TRUE or FALSE targets.

The BPF Machine

A pseudo-instruction representation of the same filter described above for earlier versions of BPF in Linux kernel can be shown as,

l0:    ldh [12]
l1: jeq #0x800, l3, l2
l2:     jeq #0x805, l3, l8
l3: ld [26]
l4: jeq #SRC, l4, l8
l5:     ld len
l6:     jlt 0x400, l7, l8
l7: ret #0xffff
l8: ret #0

To know how to read these BPF instructions, look at the filter documentation in Kernel source and see what each line does. Each of these instructions are actually just bytecodes which the BPF machine interprets. Like all real machines, this requires a definition of how the VM internals would look like. In the Linux kernel’s version of the BPF based in-kernel filtering technique they adopted, there were initially just 2 important registers, A and X with another 16 register ‘scratch space’ M[0-15]. The Instruction format and some sample instructions for this earlier version of BPF are shown below:

/* Instruction format: { OP, JT, JF, K }
 * OP: opcode, 16 bit
 * JT: Jump target for TRUE
 * JF: Jump target for FALSE
 * K: 32 bit constant
 */

/* Sample instructions*/
{ 0x28,  0,  0, 0x0000000c },     /* 0x28 is opcode for ldh */
{ 0x15,  1,  0, 0x00000800 },     /* jump next to next instr if A = 0x800 */
{ 0x15,  0,  5, 0x00000805 },     /* jump to FALSE (offset 5) if A != 0x805 */
..

There were some radical changes done to the BPF infrastructure recently – extensions to its instruction set, registers, addition of things like BPF-maps etc. We shall discuss what those changes in detail, probably in the next post in this series. For now we’ll just see the good ol’ way of how BPF worked.

Interpreter

Each of the instructions seen above are represented as arrays of these 4 values and each program is an array of such instructions. The BPF interpreter sees each opcode and performs the operations on the registers or data accordingly after it goes through a verifier for a sanity check to make sure the filter code is secure and would not cause harm. The program which consists of these instructions, then passes through a dispatch routine. As an example, here is a small snippet from the BPF instruction dispatch for the instruction ‘add’ before it was restructured in Linux kernel v3.15 onwards,

127         u32 A = 0;                      /* Accumulator */
128         u32 X = 0;                      /* Index Register */
129         u32 mem[BPF_MEMWORDS];          /* Scratch Memory Store */
130         u32 tmp;
131         int k;
132
133         /*
134          * Process array of filter instructions.
135          */
136         for (;; fentry++) {
137 #if defined(CONFIG_X86_32)
138 #define K (fentry->k)
139 #else
140                 const u32 K = fentry->k;
141 #endif
142 
143                 switch (fentry->code) {
144                 case BPF_S_ALU_ADD_X:
145                         A += X;
146                         continue;
147                 case BPF_S_ALU_ADD_K:
148                         A += K;
149                         continue;
150 ..

Above snippet is taken from net/core/filter.c in Linux kernel v3.14. Here, fentry is the socket_filter structure and the filter is applied to the sk_buff data element. The dispatch loop (136), runs till all the instructions are exhaused. The dispatch is basically a huge switch-case dispatch with each opcode being tested (143) and necessary action being taken. For example, here an ‘add’ operation on registers would add A+X and store it in A. Yes, this is simple isn’t it? Let us take it a level above.

JIT Compilation

This is nothing new. JIT compilation of bytecodes has been there for a long time. I think it is one of those eventual steps taken once an interpreted language decides to look for optimizing bytecode execution speed. Interpreter dispatches can be a bit costly once the size of the filter/code and the execution time increases. With high frequency packet filtering, we need to save as much time as possible and a good way is to convert the bytecode to native machine code by Just-In-Time compiling it and then executing the native code from the code cache. For BPF, JIT was discussed first in the BPF+ research paper by Begel etc al. in 1999. Along with other optimizations (redundant predicate elimination, peephole optimizations etc,) a JIT assembler for BPF bytecodes was also discussed. They showed improvements from 3.5x to 9x in certain cases. I quickly started seeing if the Linux kernel had done something similar. And behold, here is how the JIT looks like for the ‘add’ instruction we discussed before (Linux kernel v3.14),

288                switch (filter[i].code) {
289                case BPF_S_ALU_ADD_X: /* A += X; */
290                        seen |= SEEN_XREG;
291                        EMIT2(0x01, 0xd8);              /* add %ebx,%eax */
292                        break;
293                case BPF_S_ALU_ADD_K: /* A += K; */
294                        if (!K)
295                                break;
296                        if (is_imm8(K))
297                                EMIT3(0x83, 0xc0, K);   /* add imm8,%eax */
298                        else
299                                EMIT1_off32(0x05, K);   /* add imm32,%eax */
300                        break;

As seen above in arch/x86/net/bpf_jit_comp.c for v3.14, instead of performing operations during the code dispatch directly, the JIT compiler emits the native code to a memory area and keeps it ready for execution.The JITed filter image is built like a function call, so we add some prologue and epilogue to it as well,

/* JIT image prologue */
221                EMIT4(0x55, 0x48, 0x89, 0xe5); /* push %rbp; mov %rsp,%rbp */
222                EMIT4(0x48, 0x83, 0xec, 96);    /* subq  $96,%rsp       */

There are rules to BPF (such as no-loop etc.) which the verifier checks before the image is built as we are now in dangerous waters of executing external machine code inside the linux kernel. In those days, all this would have been done by bpf_jit_compile which upon completion would point the filter function to the filter image,

774                 fp->bpf_func = (void *)image;

Smooooooth… Upon execution of the filter function, instead of interpreting, the filter will now start executing the native code. Even though things have changed a bit recently, this had been indeed a fun way to learn how interpreters and JIT compilers work in general and the kind of optimizations that can be done. In the next part of this post series, I will look into what changes have been done recently, the restructuring and extension efforts to BPF and its evolution to eBPF along with BPF maps and the very recent and ongoing efforts in hist-triggers. I will discuss about my experiemntal userspace eBPF library and it’s use for LTTng’s UST event filtering and its comparison to LTTng’s bytecode interpreter. Brendan’s blog-post is highly recommended and so are the links to ‘More Reading’ in that post.

Thanks to Alexei Starovoitov, Eric Dumazet and all the other kernel contributors to BPF that I may have missed. They are doing awesome work and are the direct source for my learnings as well. It seems, looking at versatility of eBPF, it’s adoption in newer tools like shark, and with Brendan’s views and first experiemnts, this may indeed be the next big thing in tracing.

Standard
Embedded, Kernel, Linux

Jumping the Kernel-Userspace Boundary – Procfs and Ioctl

I recently had a need to have a very fast and scalable way to share moderate chunks of data between my experimental kernel module and the userspace application. Of course, there are many ways already available. Some of them are documented very nicely here. I will be writing in a few blog posts sharing what all mechanisms I have used to transfer data and provide such interfaces.

Procfs

I have used the Procfs before (with the seq_file API) when I needed to read my experimental results back in userspace and perform aggregation and further analysis there only. It usually consisted of a stream of data which I sent to my /proc/foo file. From a userspace perspective, it is essentially a trivial read-only operation in my case,

/* init stuff */
static struct proc_dir_entry *proc_entry;
/* Create procfs entry in module init */
proc_entry = proc_create("foo", 0, NULL, &foo_fops);
/* The operations*/
static const struct file_operations foo_fops = {
    .owner = THIS_MODULE,
    .open = foo_open,
    .read = seq_read,
    .llseek = seq_lseek,
    .release = single_release,
};
/ *Use seq_printf to provide access to some value from module */
static int foo_print(struct seq_file *m, void *v) {
    seq_printf(m, val);
    return 0;
}

static int foo_open(struct inode *inode, struct  file *file) {
    return single_open(file, foo_print, NULL);
}
/* Remove procfs entry in module exit */
remove_proc_entry("foo", NULL);

Ioctl

I also used ioctl before (More importantly, I call them eye-awk-till. *grins*). They are used in situations when the interaction between your userspace applicatoin and the module resembles actual commands on which action from the kernel has to be performed. With each command, the userspace can send a message containing some data which the module can use to take actions. As an example, consider a device driver for a device which measures temperature from 2 sensors in a cold room. The driver can provide certain commands which are executed when the userspace makes ioctls. Each commad is associated with a number called as ioctl number which the device developer chooses. In a smiliar fashion to Procfs interface, file_operations struct can be defined with a new entry and initializations are done in the module,

/* File operations */
static const struct file_operations temp_fops = {  
       .owner = THIS_MODULE,  
       .unlocked_ioctl = temp_ioctl, 
};
/* The ioctl */
int temp_ioctl(struct file *filep, unsigned int cmd, unsigned long arg) {
	switch(cmd) {
	case READ_TEMP_SENSOR_1:	
		copy_to_user((char *)arg, temp_buff, 8);
		break;	
	case READ_TEMP_SENSOR_2:
		copy_to_user((char *)arg, temp_buff, 8);
		break;
        }
}

There are other complexities involved as well, such as using _IO(), _IOR() macros to define safe ioctl numbers. To know more about ioctl() call and how it is used, I suggest you read Chapter 7 from LKMPG. Note that newer kernels have some minor changes in code, hence refer to some device drivers using ioctls inlatest kernel releases. Each ioctl in our case means we have to use copy data from user to kernel or from kernel to user using copy_fom_user() or copy_to_user() functions. There is also no way to avoid the context switch. For small readings done ocassionally, this is an OK mechanism I would say. Consider that in a parallel universe, this sensor system aggregates temperature as well as a high quality thermal image in addition to each measurement. Also, there are thousands of such sensors spread across a lego factory and are being read each second from a common terminal. For such huge chunks of data accessed very frequently this each additional copy is a performance penalty. For such scenarios, I used the mmap() functionalty provided to share a part of memory between the kernel and userspace. I shall discuss more about Mmap in my next post.

Standard
Android, Java, Linux, UX/UI

QRite – QR Code Generator

UPDATE: Tanushri recently won a LG G Watch watch in PyCon 2015 (thanks to Google), so we have a watch to start implementing the smartwatch feature. The app will now be free on Google Play as well, as we don’t need money anymore 🙂

I had recently bought a smart-watch (SmartQ Z) and as mentioned in some of my previous posts, I started playing around and creating my own watch-faces. One fine day, I got an idea to put my contact details on the watch screen as a widget showing a QR code (with my vCard encoded) so that if someone asks me for my details, I could just flash my wrist and they could scan and save my contact info. Geek lvl over 9999.

So, I spent some a few evenings with a friend, re-inventing the wheel and created first my QR Code generation app. It was mostly an Android revision for us with some UX/UI brainstorming done now and then. The goal was to make it simple. Very simple. And clean. With just the necessary customizations given to the user. This is how it looks till now:

screenshots

You can check out the beta attempt, get some more details and screenshots here : http://qrite.suchakra.in/ Its an open source app and if you want to use it or want to contribute to the source code, head over to this Github repo. The source is not so rosy and glorious considering I just focused on functionality and gave exactly 0 about anything else :/ It needs some cleanup for sure and it is indeed the next step.

So there are some features already available as configuring color, size and recent contact details for which QR code was generated. And some features are to be added, such as digitizing an already available QR code using your camera and ‘scanning’. The major feature, “Send to Smartwatch” is also left. The plans are to support Android Wear, Pebble and generic android (such as SmartQ Z) platforms. However, I don’t have Android Wear/Pebble for which this could be most useful. If you want to donate a Android Wear or Pebble (if you have one extra) or some money for me to get those, or if you just want to support open source development, you can consider buying the app from this Play Store link (it will be made free as soon as all features are completed). You can also send a donation by clicking 

Just FYI, my goal is approx USD $130 (price of cheapest LG W100 watch). Feedback and suggestions for the app are welcome.

TL;DR – Just another QR code generation app. Open sourced. Smartwatch integration in progress. Donate money for Android Wear/Pebble or submit code if you want.

Standard
Linux, UX/UI

Ask Fedora UX Redesign Updates #2

So taking into consideration most of the suggestions I had obtained during the recent Design FAD at Red Hat, the initial slides of desktop version are also ready. Maybe these are enough to start off with a basic CSS template which we can build upon iteratively while we work on more mockups for other major pages in parallel. Here is the updated mockup:

home-desktopJust a reminder that the color palette used here is not standard and its indicative. The standard Fedora color palette will be used in the code. The next mockups to be done are for the views for individual question pages, contributor/people page, the ‘ask question’ page and maybe the registration page if required. Most of the other stuff I think would be best done directly in the code. I was anticipating a bigger challenge in streamlining the design but personally I think, as Askbot apes the StackOverflow and similar Q&A websites’ UX to a large extent, the users already are familiar with flow of AskFedora. In any case, later on we can have something like this : http://askubuntu.com/tour – an Ask Fedora Tour page for beginners/new users so that the initial user-inertia reduces.

Contributions and comments welcome.

Standard
Linux, UX/UI

Ask Fedora UX Redesign Updates #1

The recently concluded Fedora Design FAD 2015 at Red Hat’s Westford office turned out to be quite productive where my idea of redesigning AskFedora user interface gathered some momentum. I met so many faces I had just always known as IRC nicks and above of all, enjoyed Sirko complaining to everyone for not playing Champions of Regnum that well during the gaming nights we had 🙂

So coming down to the point, I was joined by Zack (sadin) and Sarup (banas) for the initial redesign efforts. With their suggestions, I completed some high-fidelity mockups for the mobile and desktop interface intended to be used for Ask Fedora. As suggested by Sarup, we started with Mobile mockups first to get a simplistic view of user requirements. It can then be “stretched” for a desktop interface later on. After some feedback from Sirko, Emily, Mairin, Marie et al. here is a first mockup slide.

home-mobileTo get a context of changes, you will have to visit the current AskFedora instance and observe the changes. Newer slides and the desktop views are on the way. Even though this takes time, its important to have an idea of how you want your interaction with the application to be and FAD gave me a change to do some mockups before we dive into code and CSS. Which reminds me, that Zack and I managed to setup an Openshift repo of an askbot instance one night and would be mostly using it for testing out our design. (I also learnt Openshift awesomeness that night). Most of real usable UI updates will be posted on this repo : https://github.com/fedoradesign/askbot-test

Your comments and suggestions are welcome. More updates on the way.

Standard
Android, Embedded, Linux, UX/UI

Some Cool Retro Watchfaces

These holidays, I was refraining from spending huge sums on stocking gadgets I don’t need. But (un)fortunately, I ended up buying a Nexus 5, a Moga Hero controller and a cheap smartwatch. So what do you do when you get an Android device? Exactly! Start hacking on it – root, custom ROMs, custom kernel, cool apps! So, my experimentation started with the SmartQ Z Smartwatch I had bought. For the price (CAD $91, including shipping from China) this was an irresistible piece of tiny Android to start tinkering around with. It packs a 1GHz Ingenic processor (MIPS) – JZ4775, 512MB DDR RAM and 4GB flash. All of this with a tiny 1.54 inch screen with a 240×240 resolution. The latest firmware supplied by the vendor is based on Android 4.4 with a custom launcher. It is a very hacker-friendly device and came with ‘su’ out of the box 🙂 Though its a bit old (2013 launch) and the manufacturer seems to have abandoned the development on this, for the price, its a pretty impressive piece of tech on your hand.

I decided to make my own watchfaces with custom features and more inspiring UI than the watchfaces provided in the watch. Also, the hidden agenda was to check out the new Android Studio. As with everything Chinese, the SDK and docs for the Smartwatch were in Chinese! But fortunately, after surfing through XDA Developers forums, I found a link to the English docs on their website to refer to the weather APIs that I needed to use. With moderate efforts, I was able to make the following watch faces :

They are actually developed as widgets and the launcher apparently sees if the AppWidgetProvicer class you use starts with the string “WatchFace”. If this is the case, it simply puts that widget along with the custom watch faces in the menu.

If you own a similar watch/with similar screen dimensions, you can try installing the apps or use the source code for building your own cool watchfaces. I really wish I had an Android Wear watch rather than this so that I could develop on a more useful and up-to-date platform. Thanks for reading. Happy new year! Here is the source code and specs for these watch faces :

LCD Watch Face

Source : https://github.com/tuxology/LCDWatchFace

Download : lcdwatchface.apk

CRT Watch Face

Source : https://github.com/tuxology/CRTWatchFace

Download : crtwatchface.apk

If you find any bugs, report them on Github. Also, if you want me to port them on Android Wear, let me know. I’ll try to do that in emulator.

Standard